Digital Banking Accelerator (FIS)
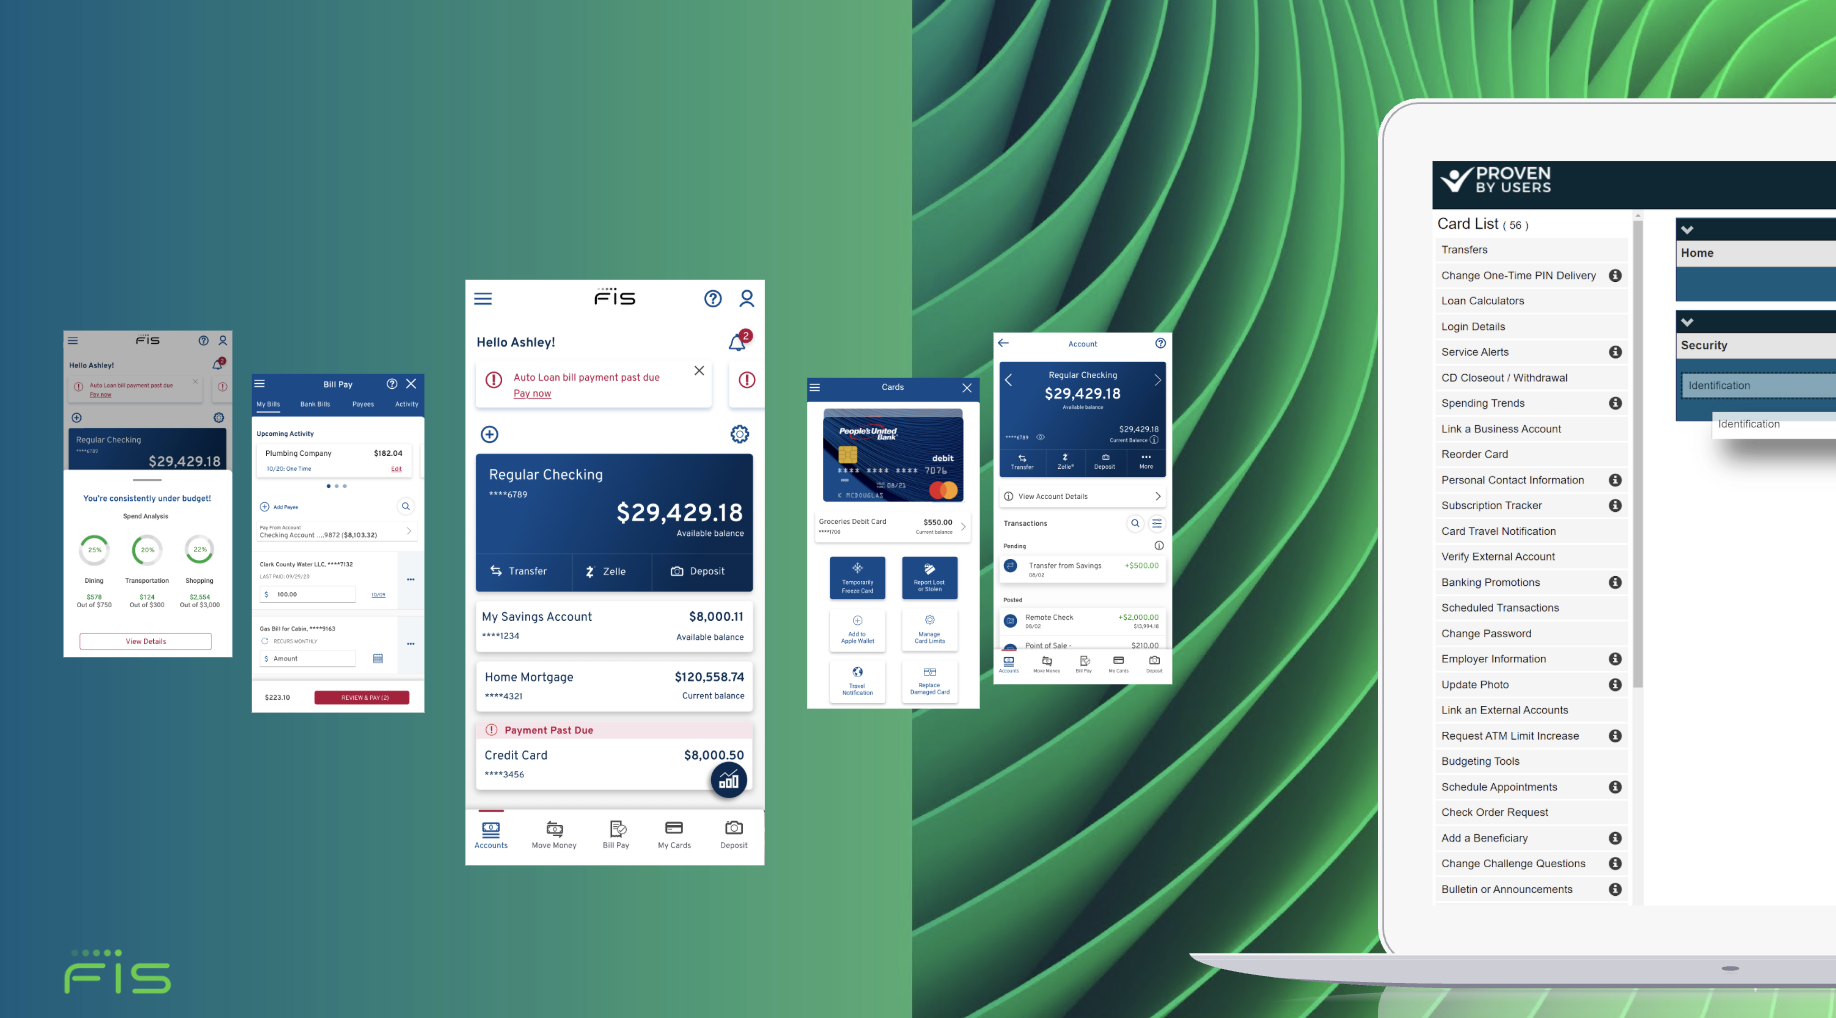
FIS, a global leader in financially technology, provided both a core banking platforms and a configurable digital front-end to financial institutions to power their customer experiences. While most clients adopted a standard front-end, one partner institution wanted leap ahead with a fully redesigned digital experience. They approached FIS with an ambitious proposal: co-invest in the development of a next-gen platform tailored specifically to their needs, while allowing FIS to later harvest the experience for future clients.
The initiative—internally referred to as the Digital Banking Accelerator—was designed to move quickly. Our client wanted to launch a significantly upgraded experience on an aggressive timeline, requiring rapid discovery, design iteration, and validation across critical journeys such as onboarding and account servicing.
My Role
As the sole researcher, I was responsible for establishing the research foundation and guiding the design process under tight time constraints. Over the course of approximately four months, I analyzed competitive and market intelligence, synthesized existing research, evaluated the platform’s navigation, and partnered closely with design through iterative concept validation. As the new experience took shape, I conducted a series of usability studies to refine onboarding flows and key account management capabilities before launch.
The project ultimately resulted in the successful launch of a modernized digital banking platform for our client. At the same time, the research generated valuable insights into customer needs and behaviors that helped FIS evolve persona segments, sales positioning, its front-end offerings for additional clients.
Organizational Scope
CX Leadership Team:
Drew Hopkins — Lead of Research
Dean Valentin — Lead of Design
Kim Busch - Creative
Tracey Dunlap — Lead of UX
Tools
UserTesting, SurveyMonkey, ProvenByUsers, AdobeXD
Competitor Research
To ground the redesign in industry trends, I researched direct and indirect competitors. I created a UXR Digital Banking database within which I could compare feature usage, navigation structure, and component choices across competitors and look for statistical trends between them. I also created catalogs of user journeys across banking platforms, looking for similarities and ingenuities among competitors.
This research reinforced the designs with the most innovative practices on the market. Competitor research justified the simplification of disclosures and login as this practice was strongly embraced by neo-bank competitors. It also motivated a major navigational change favoring submenus over sequencing.
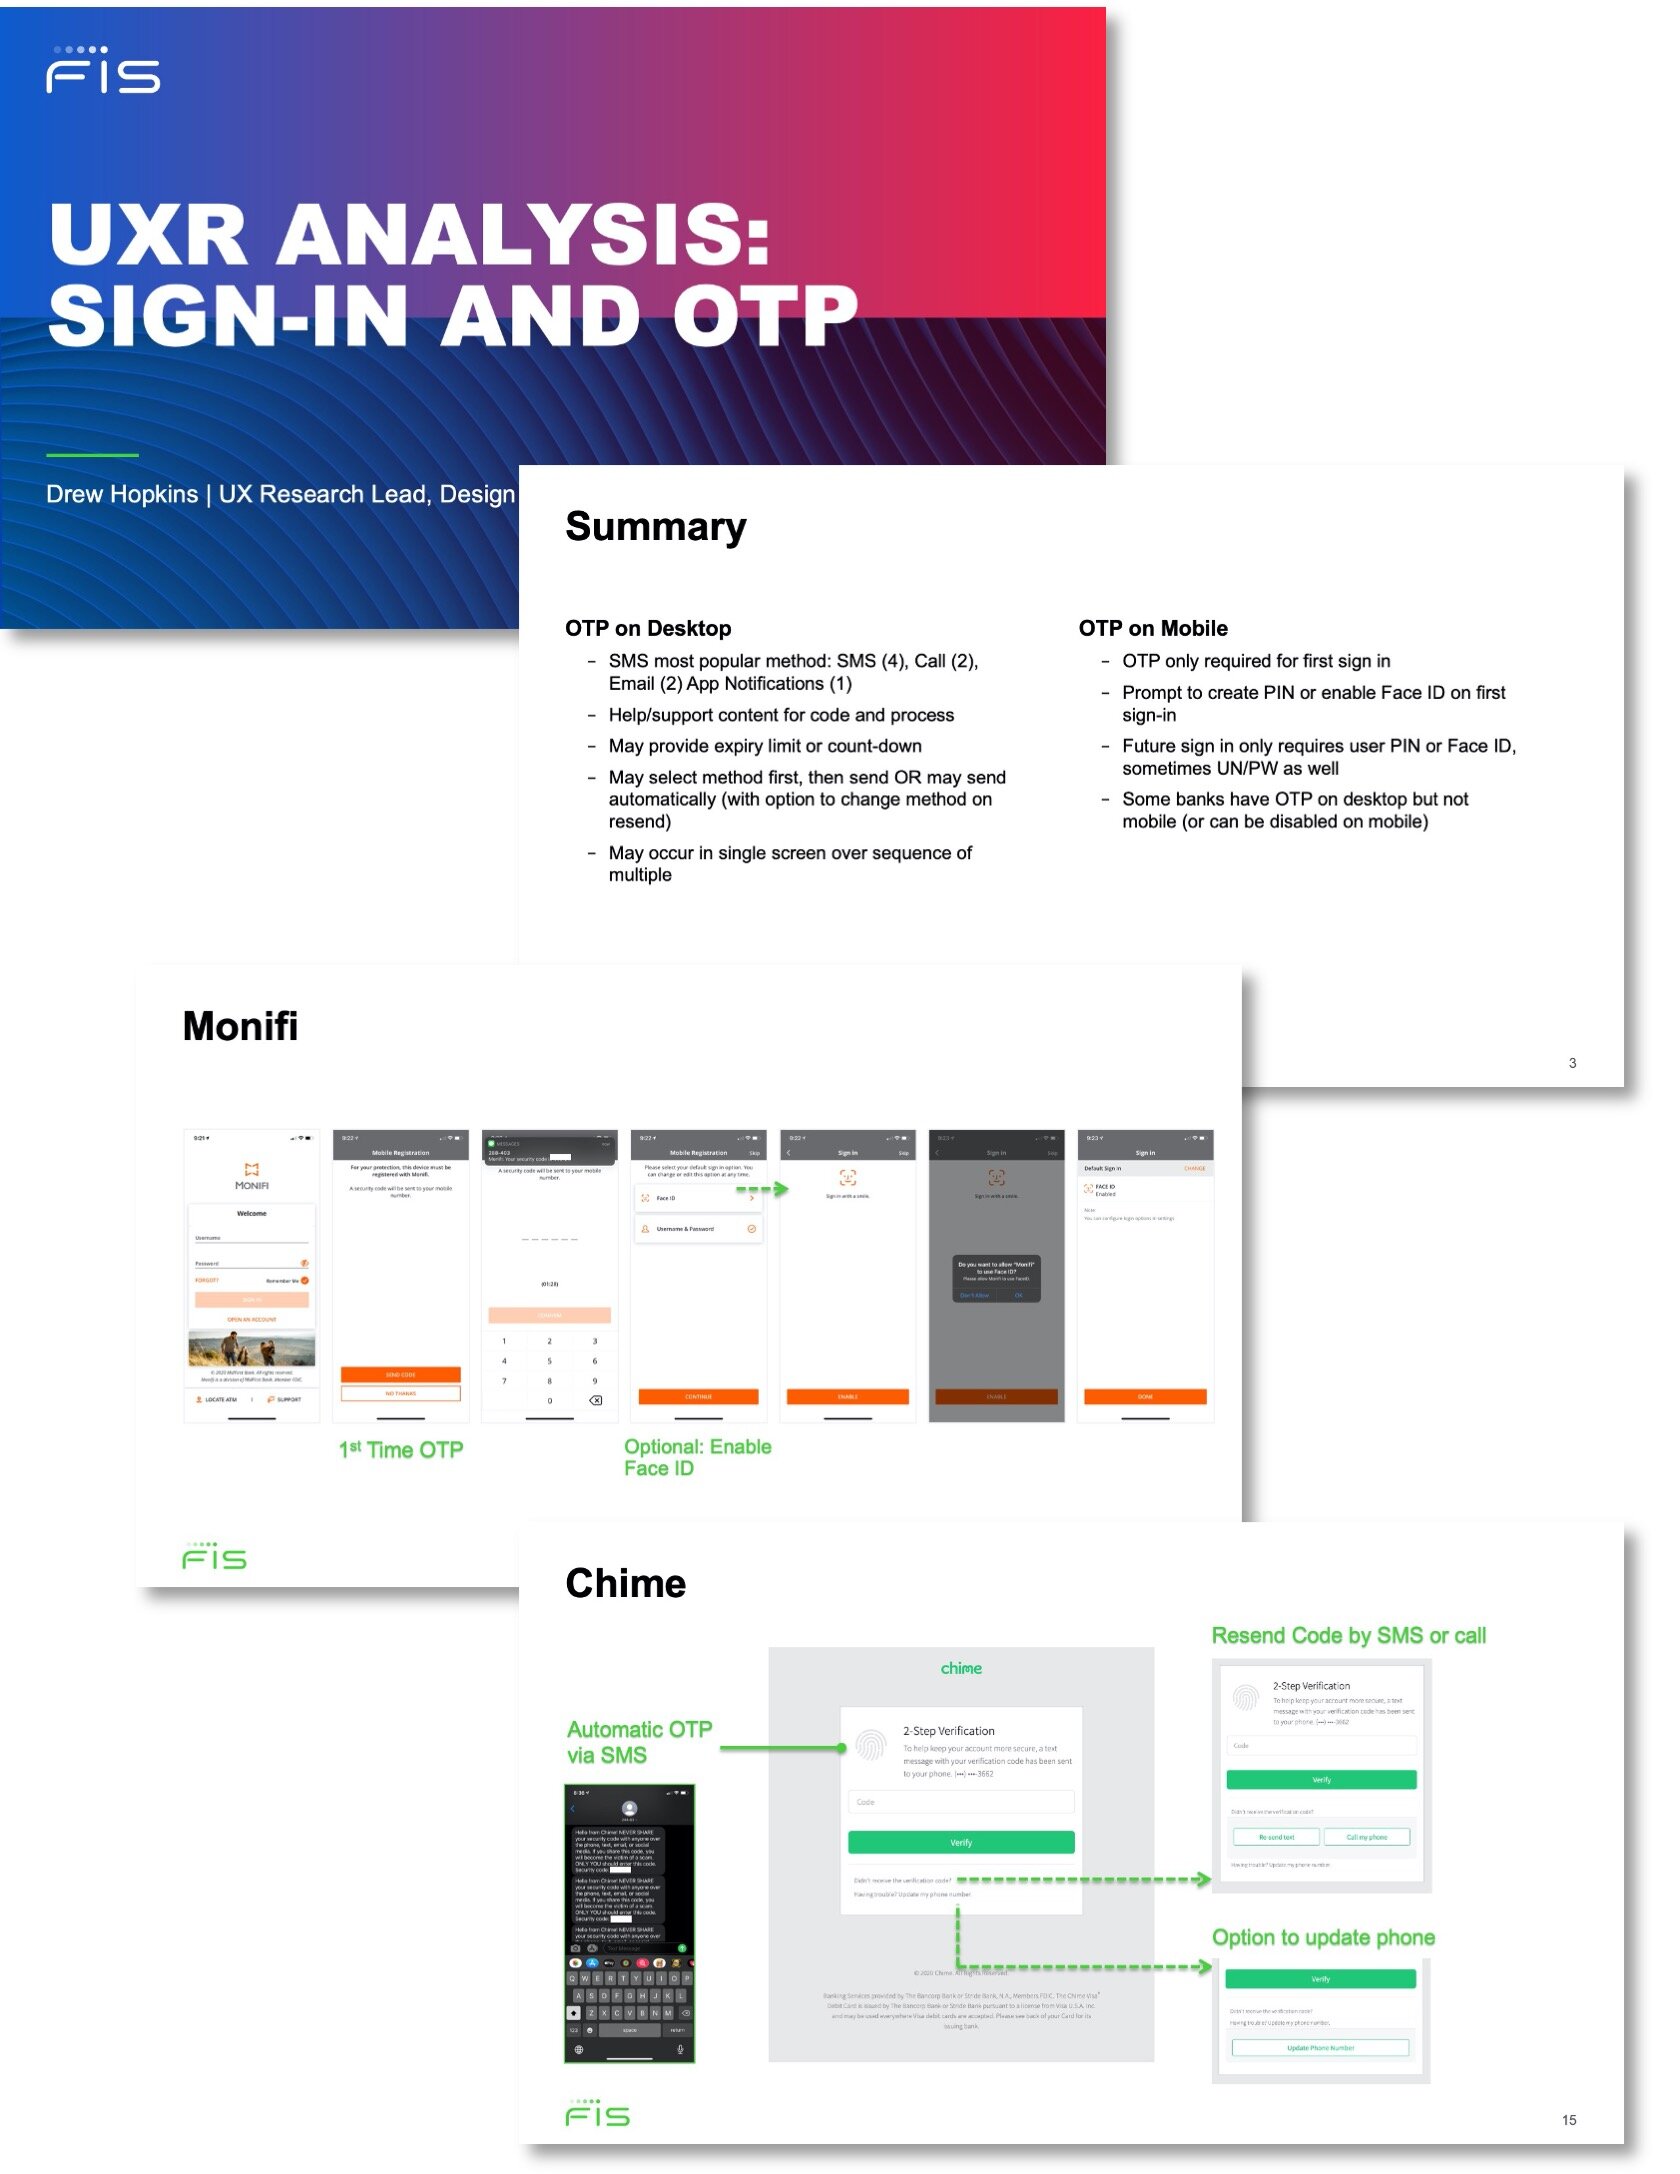
Sample of my UXR catalog on the Login Journey. This drove simplification of the Login sequence.
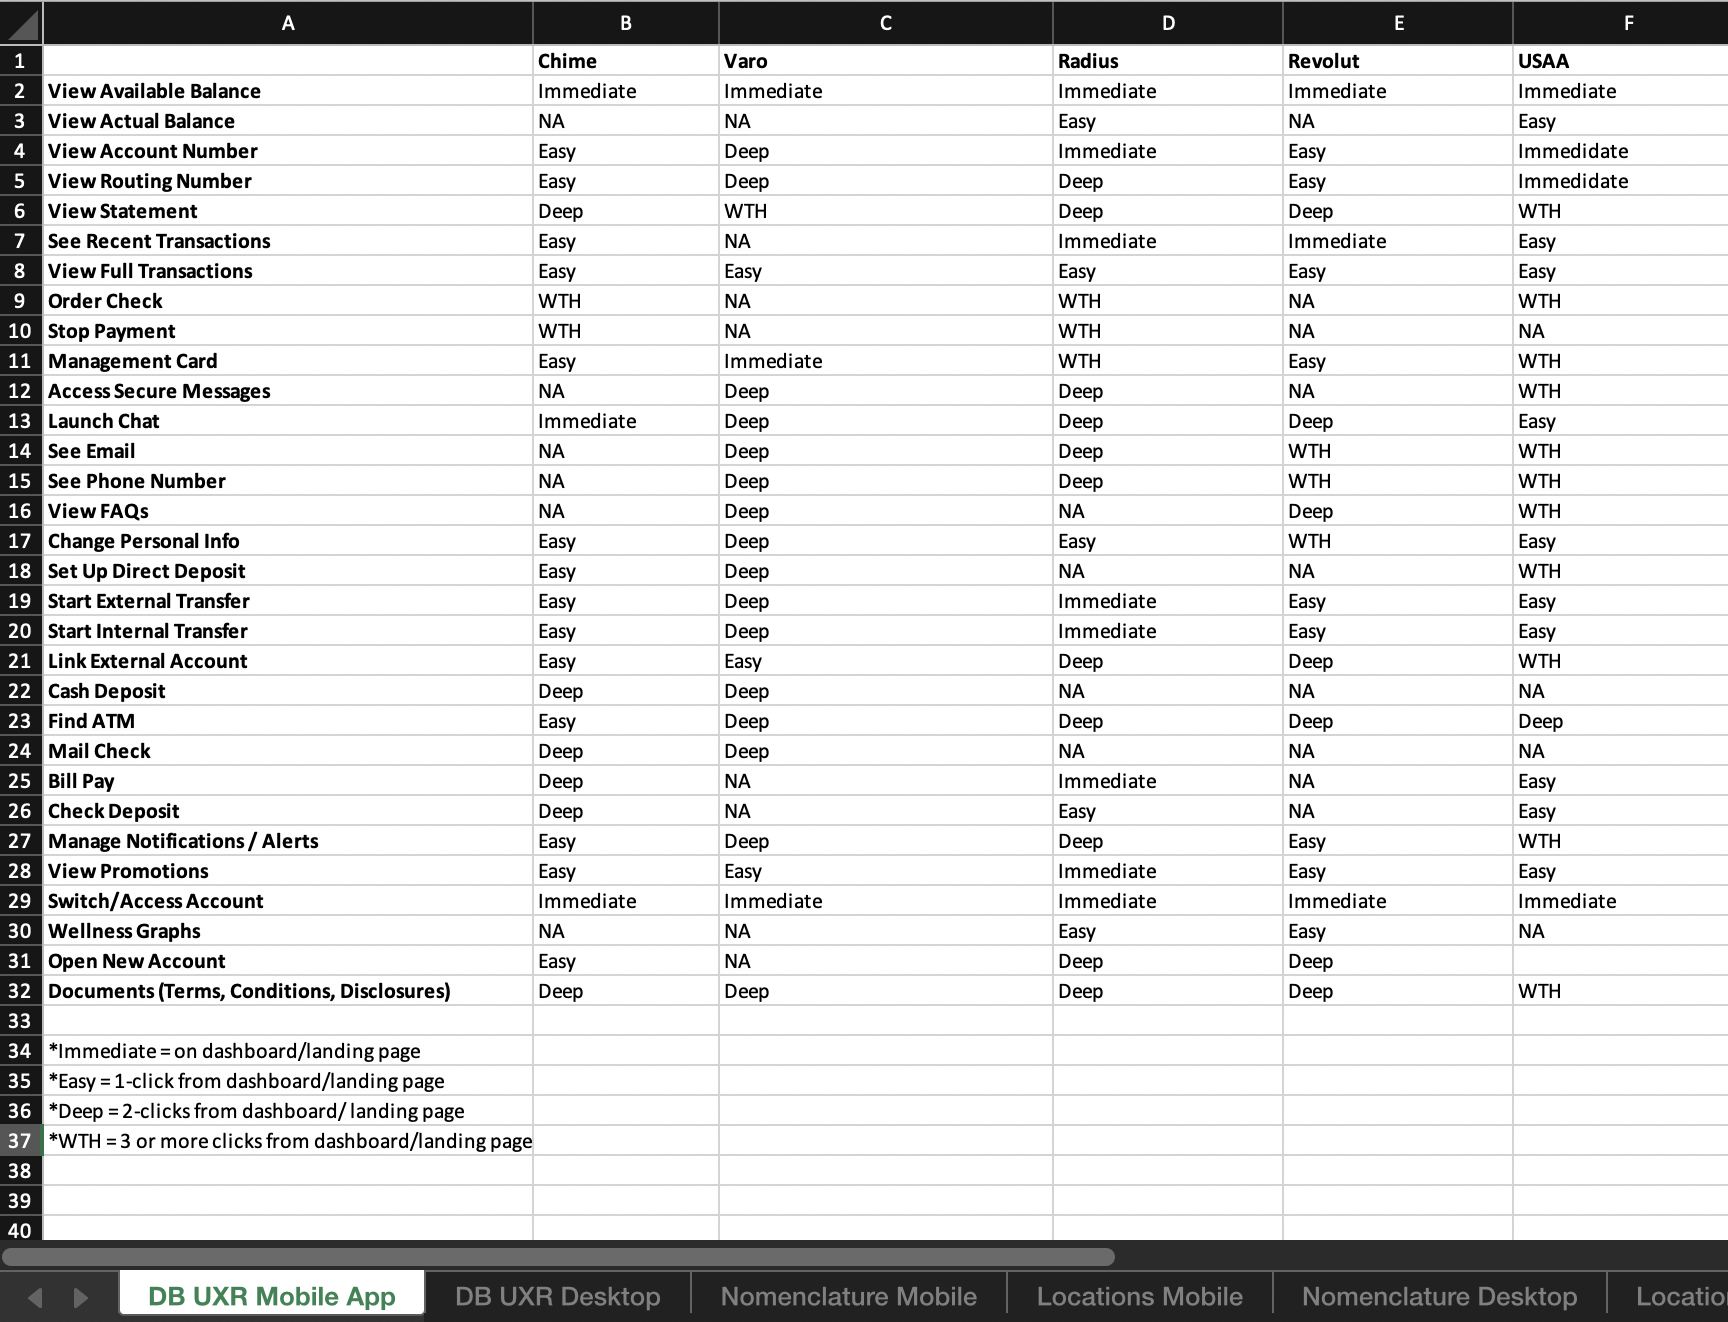
Sample from my UXR Digital Banking database. Features are rated on navigational depth across banking platforms and analyzed for trends.
Card Sort
Solid information architecture was essential for the foundation a redesign and we knew navigation posed friction in account servicing from previous research. I launched a closed card sort of 10 categories that mapped to our current system. The results would set the foundation for any major design reconfigurations.
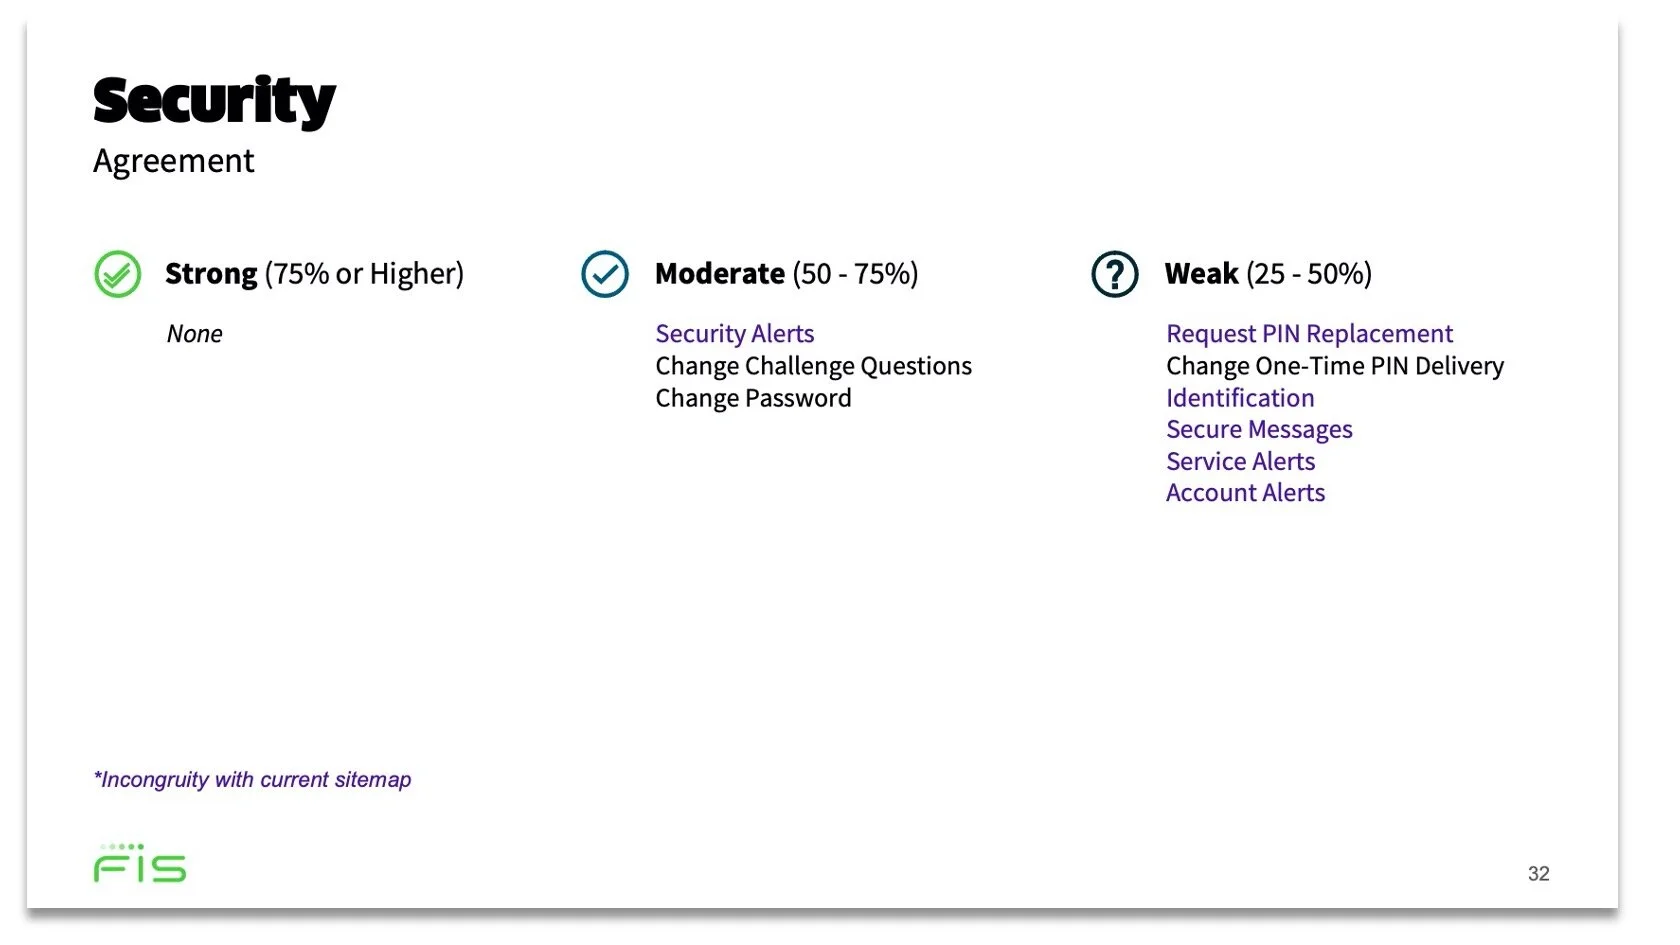
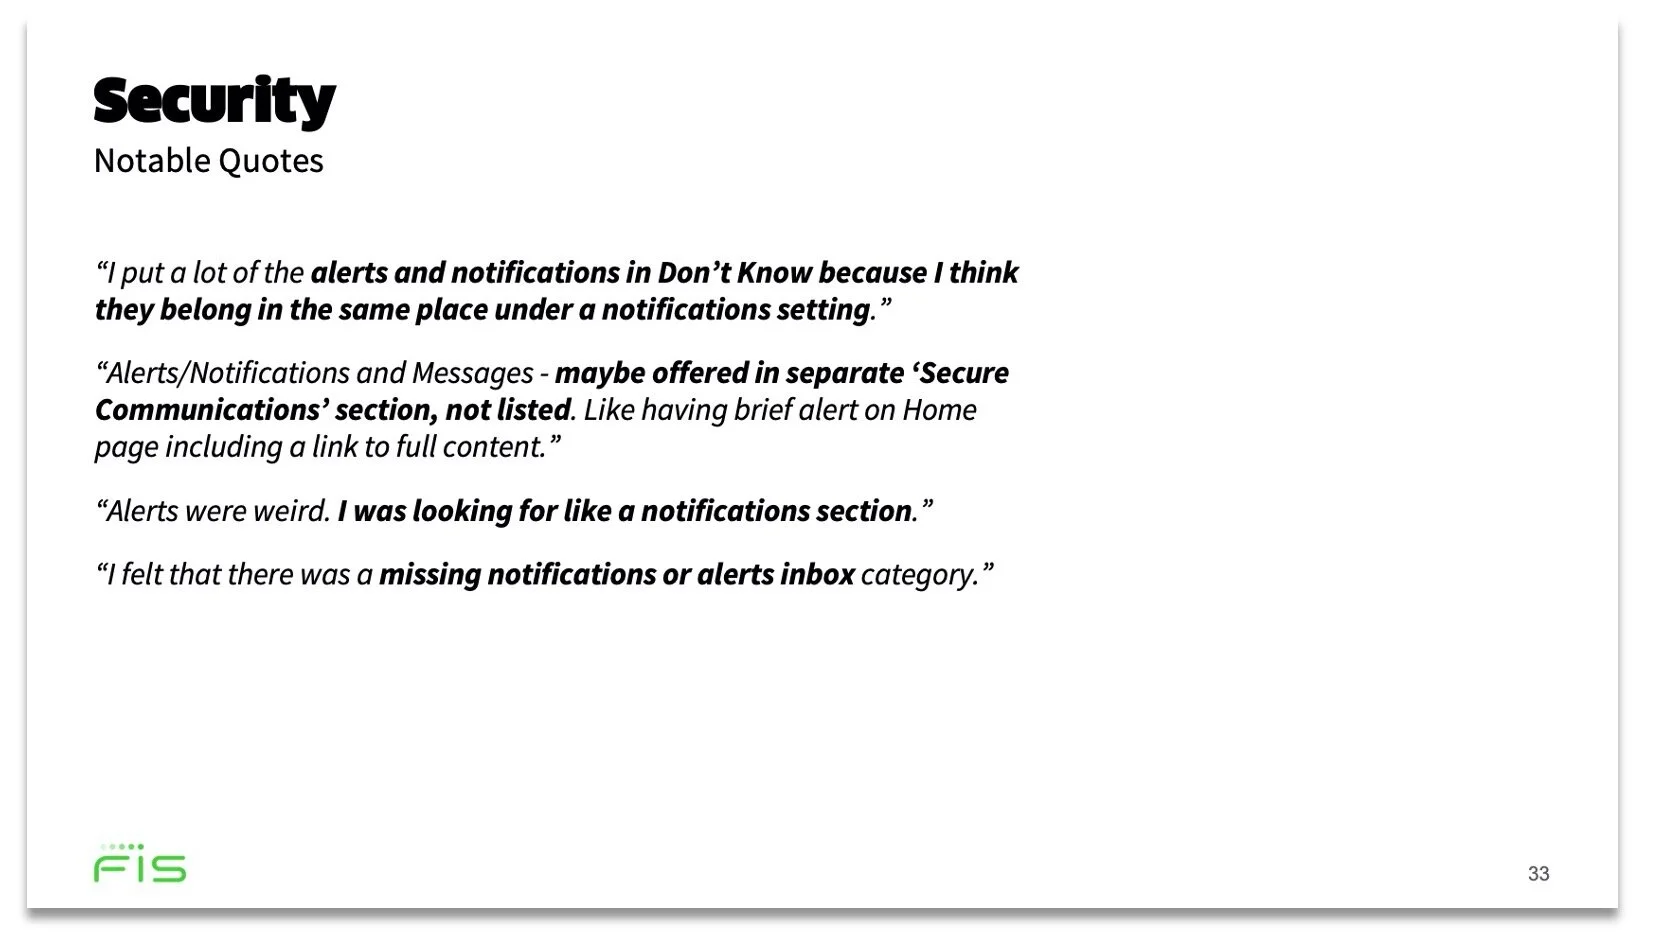
For this case study, let’s look at the results of the Security category.
The results confirmed the pattern from the previous card sort: Settings and Security was an ambiguous distinction for many. Not only that, but participants had no strong consensus on which cards to put in Security. The cards they did put there weren’t even consistent with our sitemap.
In observing the bonds and clustering between the cards irrespective of their categories, I realized that security related cards had a strong correlation with settings related cards. Security was not perceived as a valid category, but participants thought of security items like settings. I proposed we scratch the Security category all-together and relocate it’s content within submenu inside Settings. I also recommended we extract alerts out of Security as it’s own primary nav element - as this was supported by the clustering and what I found elsewhere in competitive research.
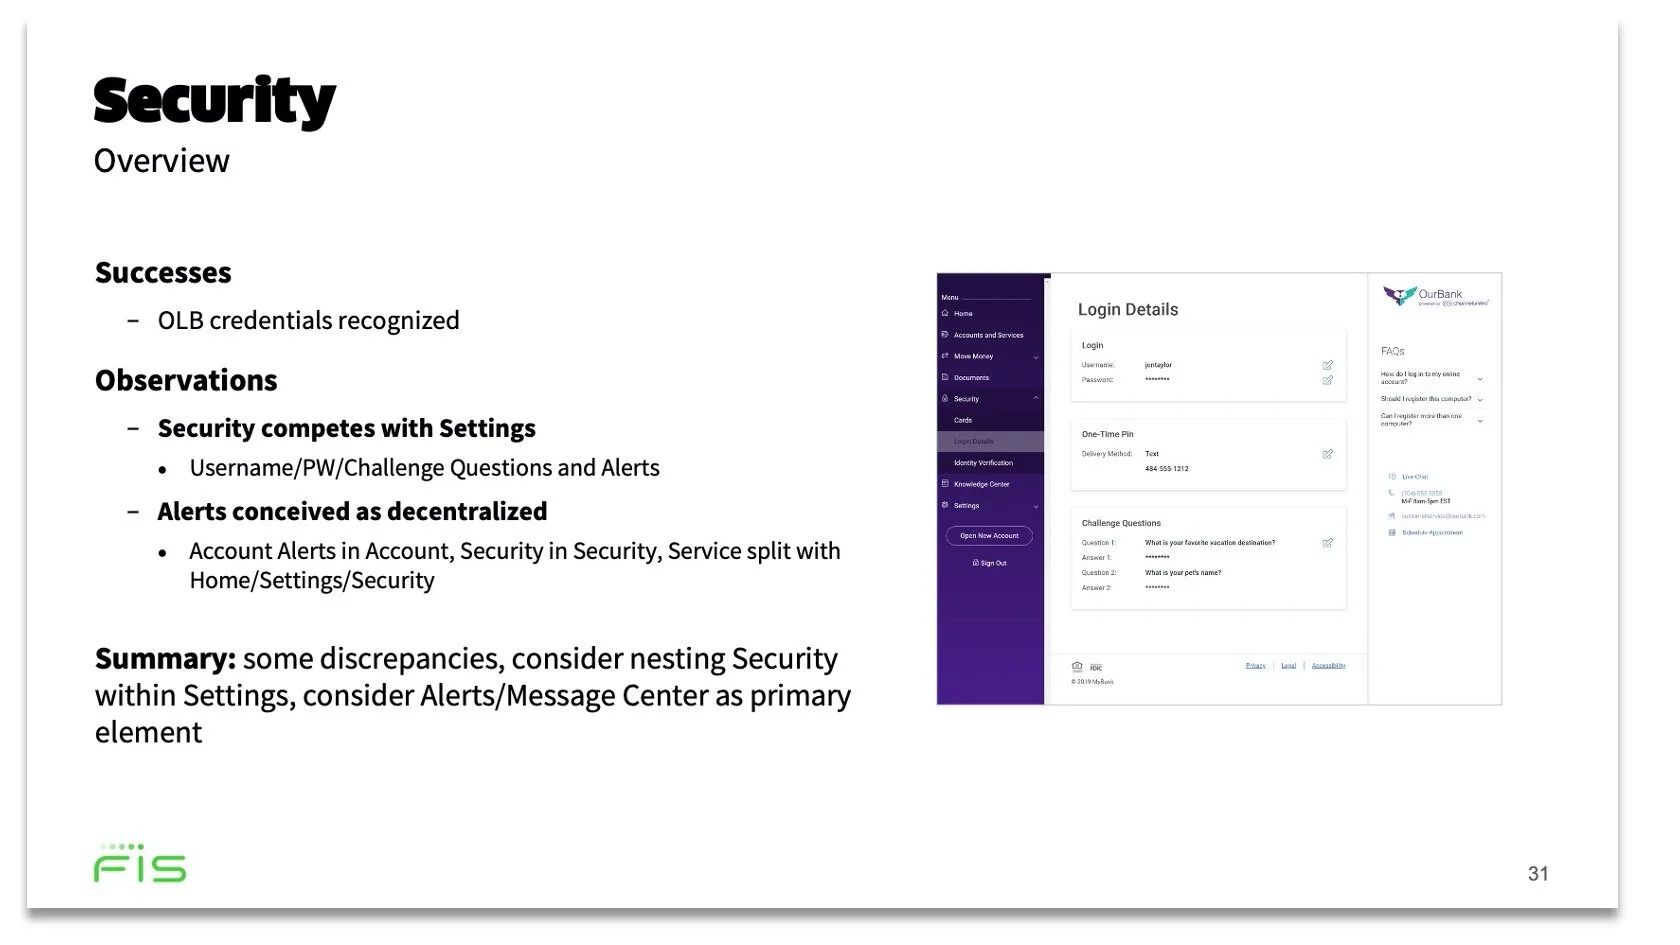
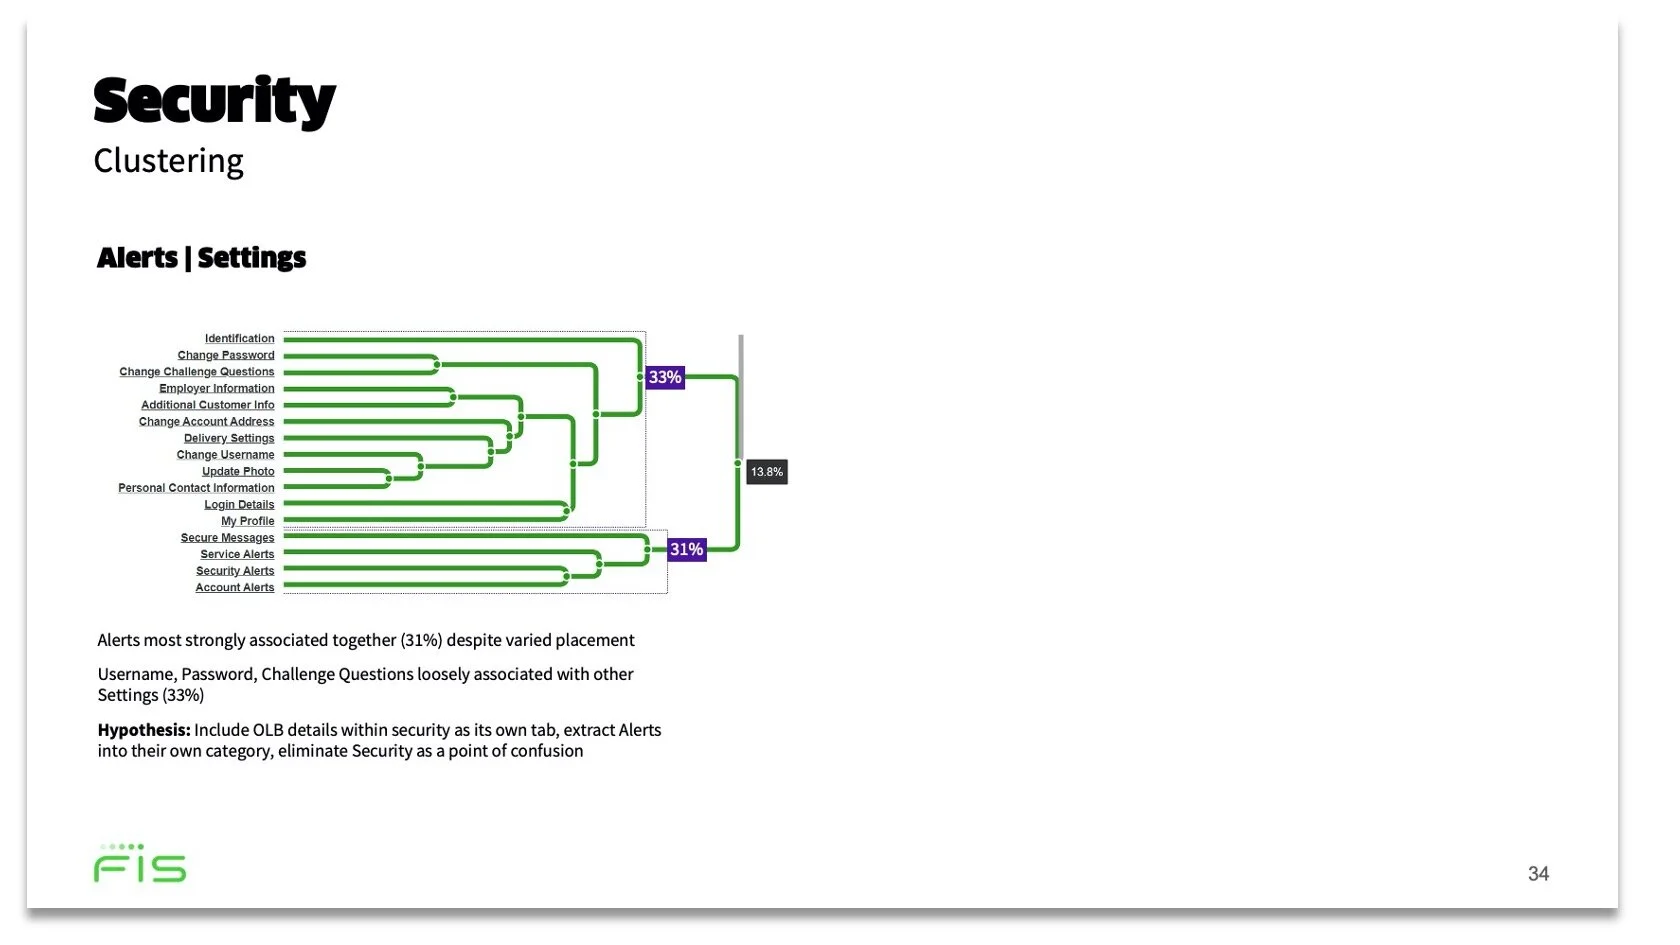
Excerpts from my 48-page analytic summary of the card sort results. Security was reimagined as Settings and Alerts.
Polls and Preference Tests
With my secondary research and navigation testing married with design team’s modern design philosophy, we saw plenty of potential improvements. As design iterated on concepts, I informed new directions with polls and preference tests. We tested aesthetics, component variations, and navigational pathways this way. We also iterated on several variations of the dashboard in particular. I aggregated and analyzed our remote testing data that advised on design and future research opportunities.
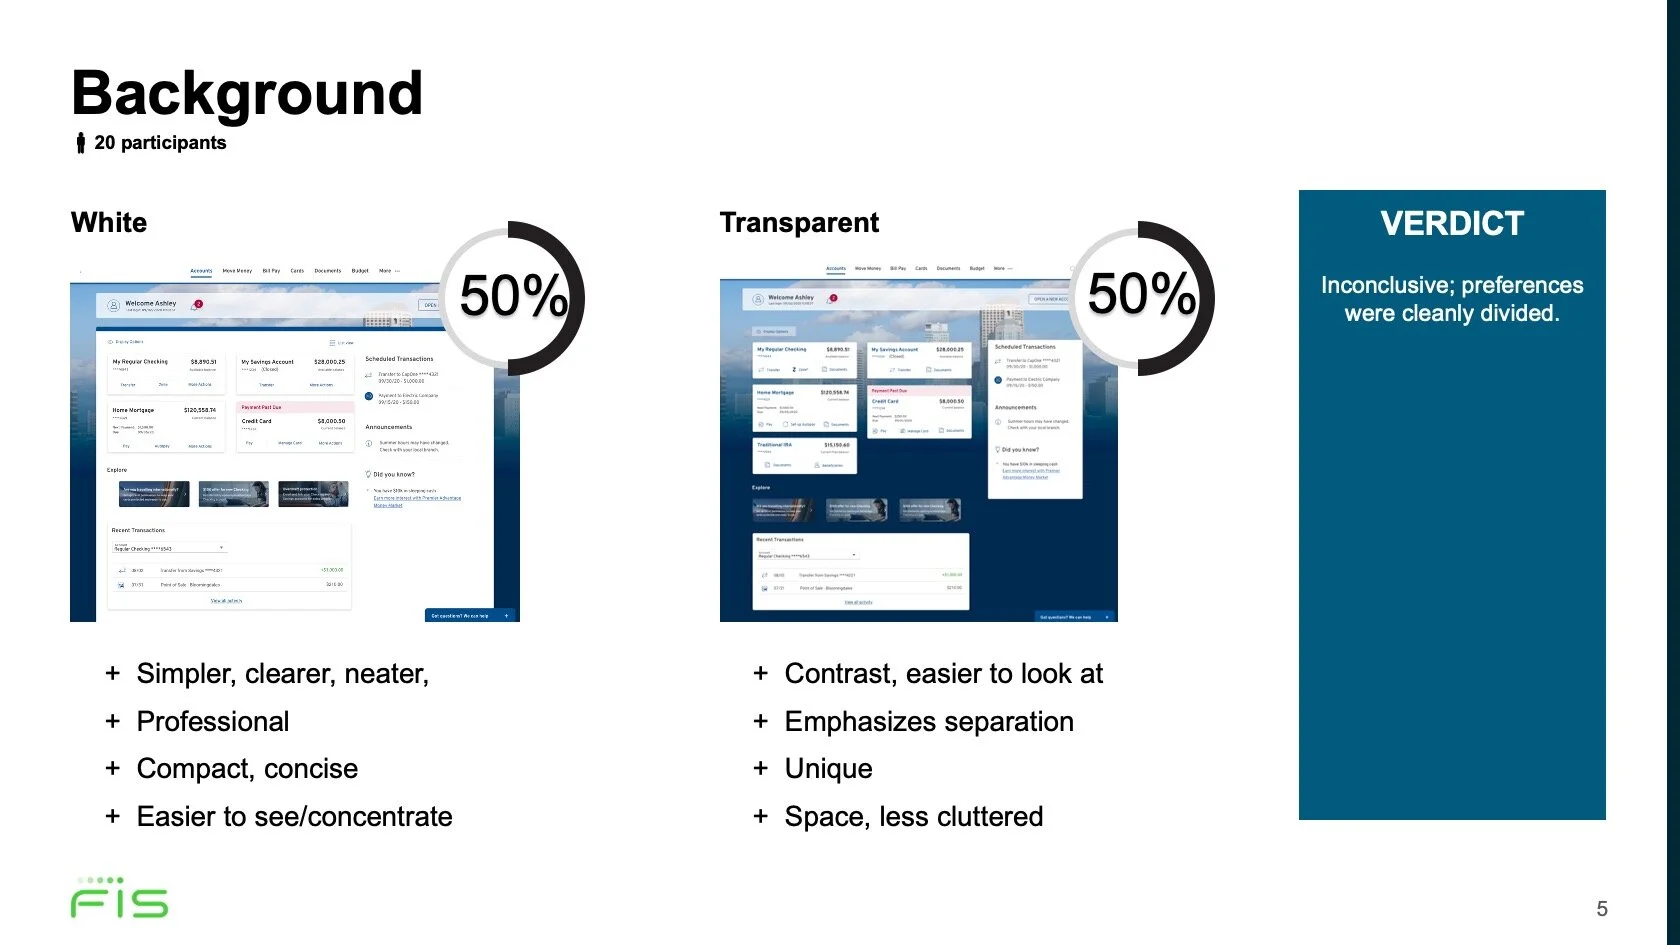

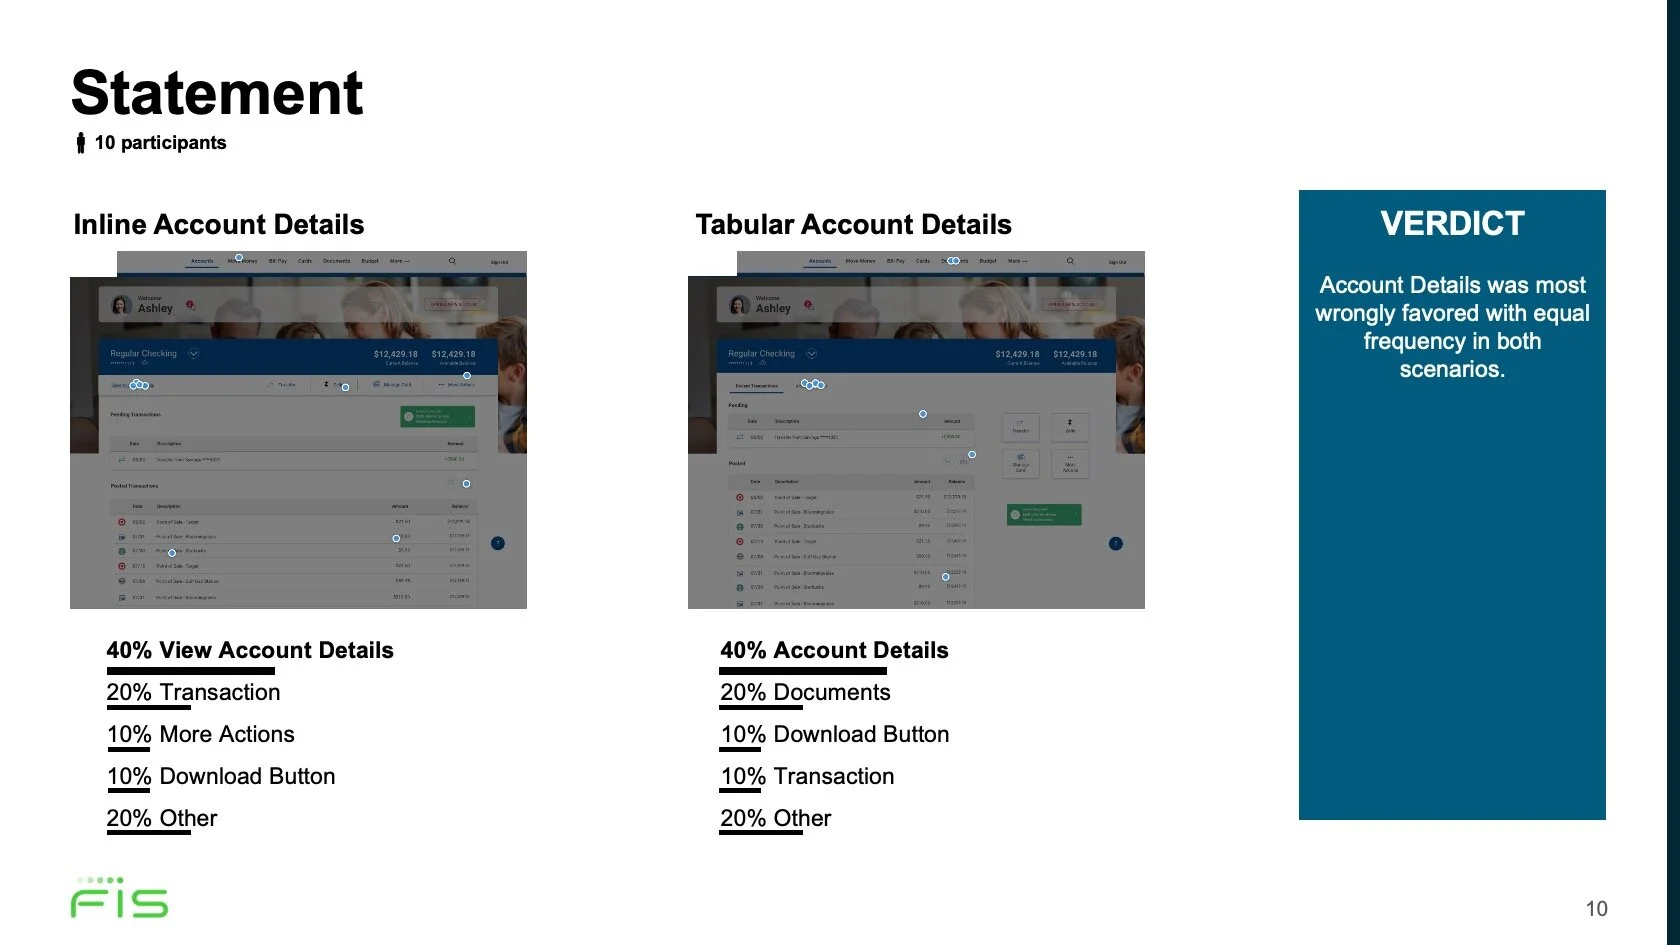
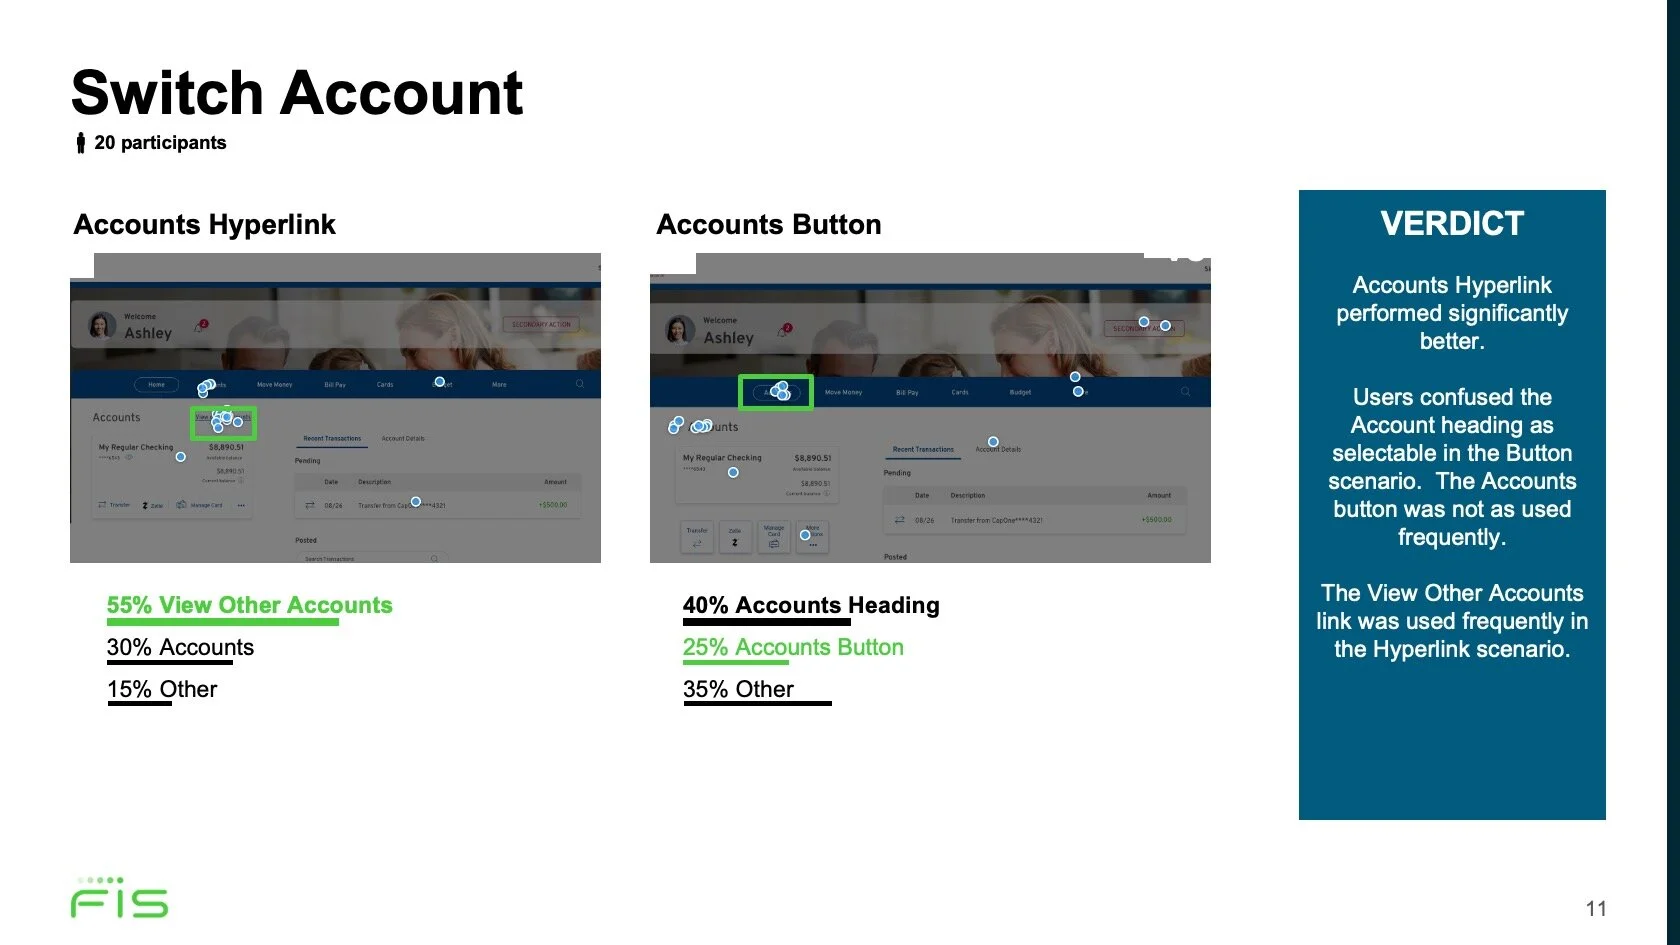

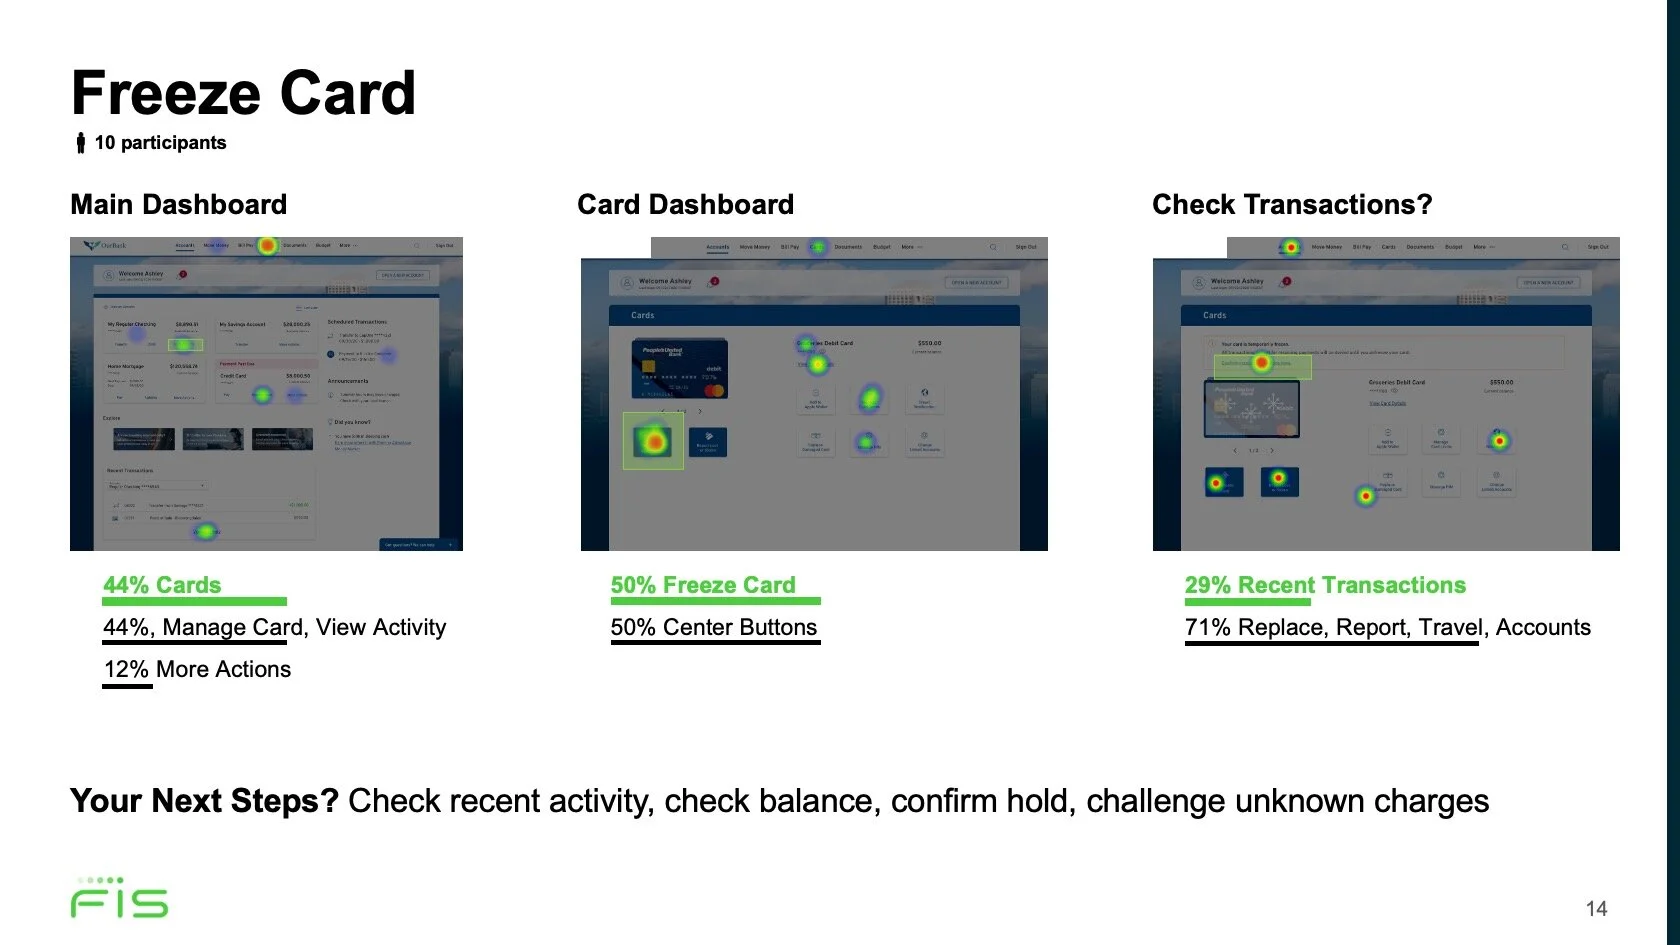
Sample of my analytics that drove some of the design’s larger refinements.
Research Boards
Usability was the heaviest focus of the redesign as our client (as with many banks) was risk-adverse and conservative. Usability testing was also an opportunity to include our client’s observations and feedback throughout our studies. That said, there were high-stakes to present and execute this stage with polish.
Since the designs were being shared through Miro, we would house our in-sprint research findings there as well. I developed a systematized Miro research boards where I could collect, analyze, and share our data. For each user journey, there would be a board to grade issues on a severity-scale and provide stats and video clips. Our clients could also leave their suggestions and questions so that we could tailor the research to address their business concerns in real-time.
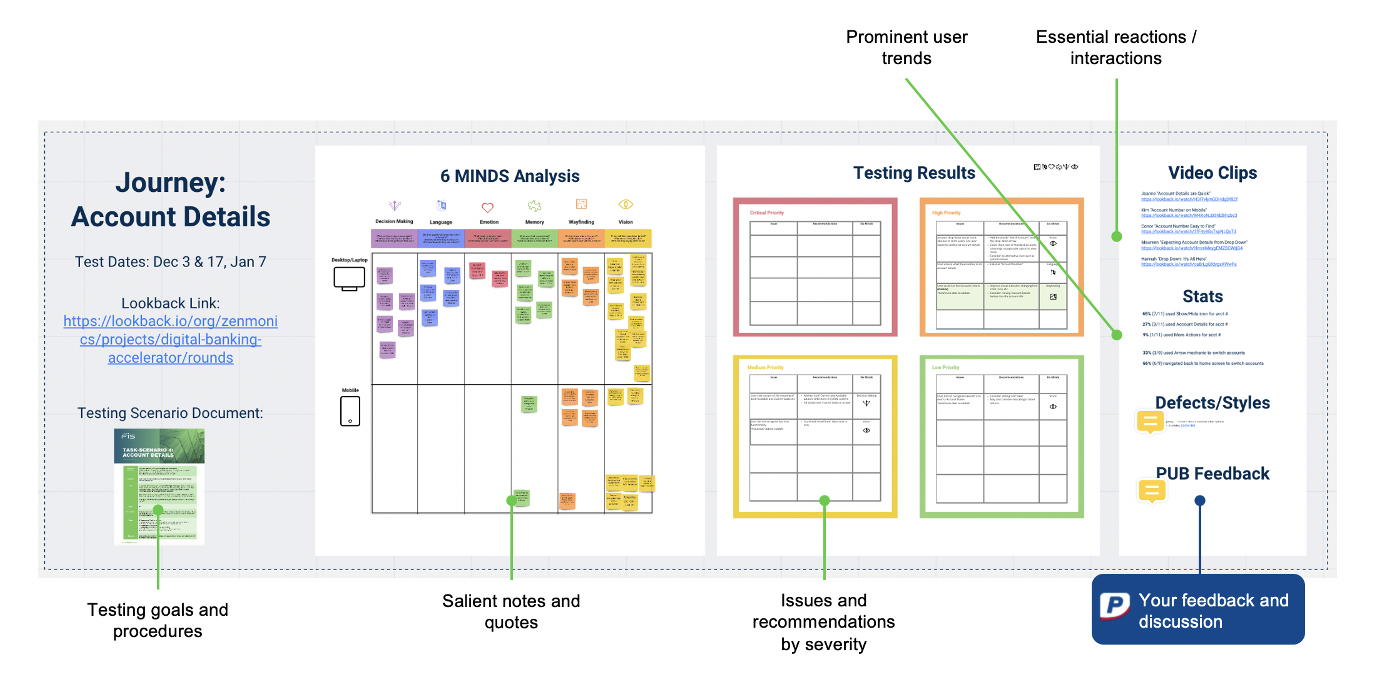
Sample board for the Account Details journey.
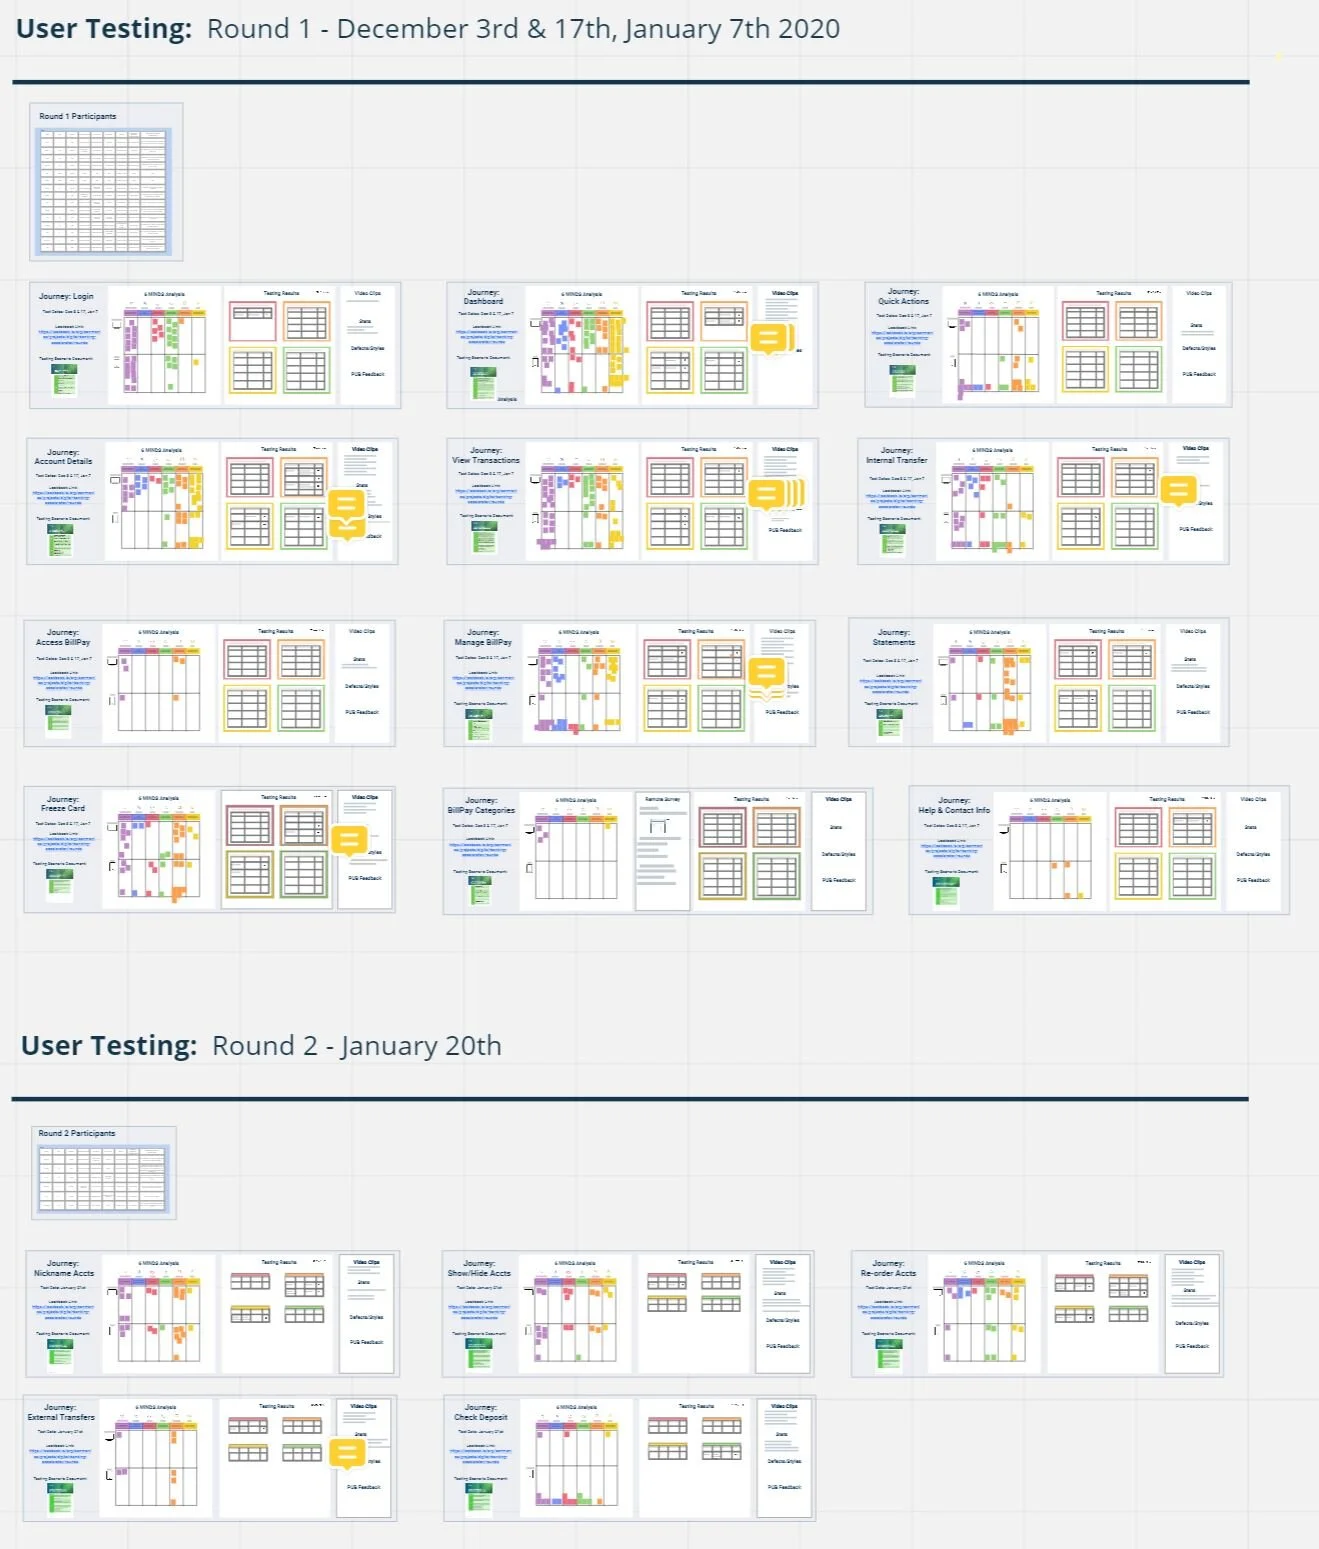
Overview of the first two sprints. Analysis, severity ratings, stats, clips - this was my brain child :)
Task-Scenarios
I evaluated the designs for each of our target use cases. I imagined the user’s context, determined needs and motivations, and identified the greatest potential weaknesses of our prototype. With this in mind, I developed scenarios for the user journeys and crafted actionable tasks that would test my hypotheses. I noted my assumptions and identified the happy-path steps that would lead to our success criteria. I then refined the prototypes and testing strategy with the designers.
These “task-scenarios” would serve as our moderator scripts during testing, but would also record our hypotheses and rationales for reference as well as give the client visibility of our process. I templated the task-scenario strategy with an instructional for future researchers.
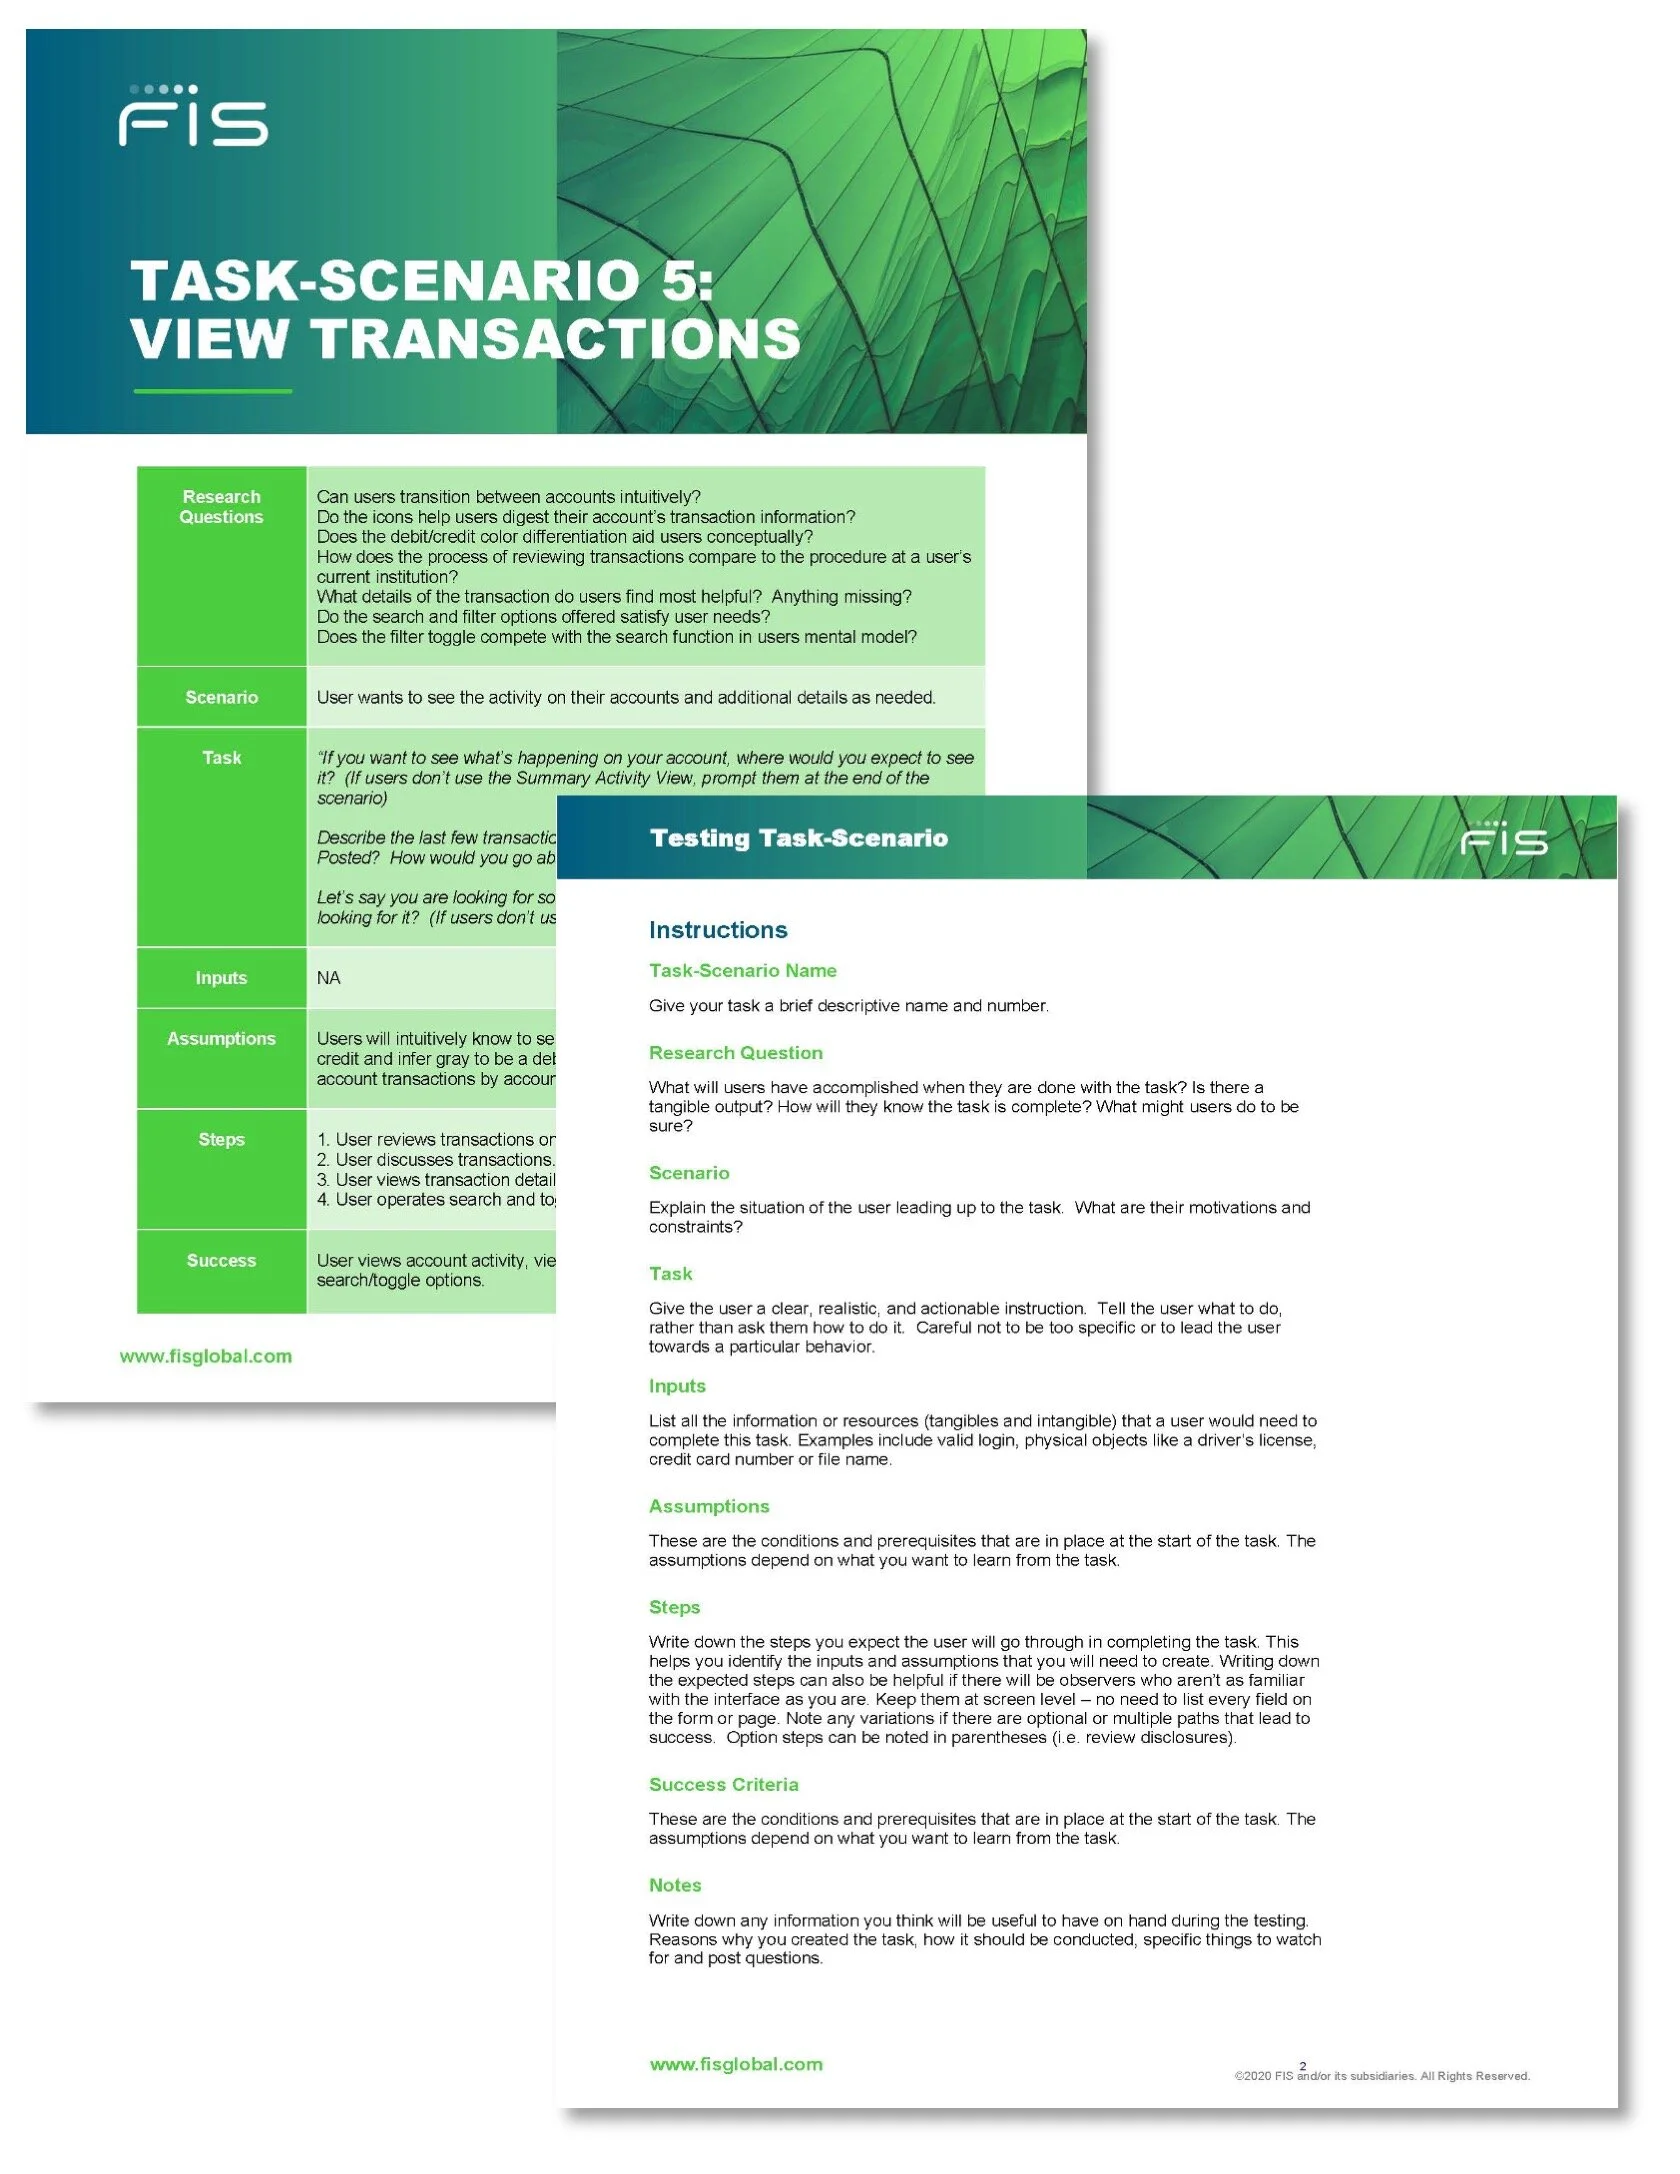
Sample Task-Scenario for the View Transactions journey. We had 28 journeys total.
Recruitment and On-boarding
We adjusted our digital banking screener to account for interest areas particular to the client and our testing:
Client membership
Account ownership
Branch Importance
BillPay usage and frequency
App dashboard usage and utility
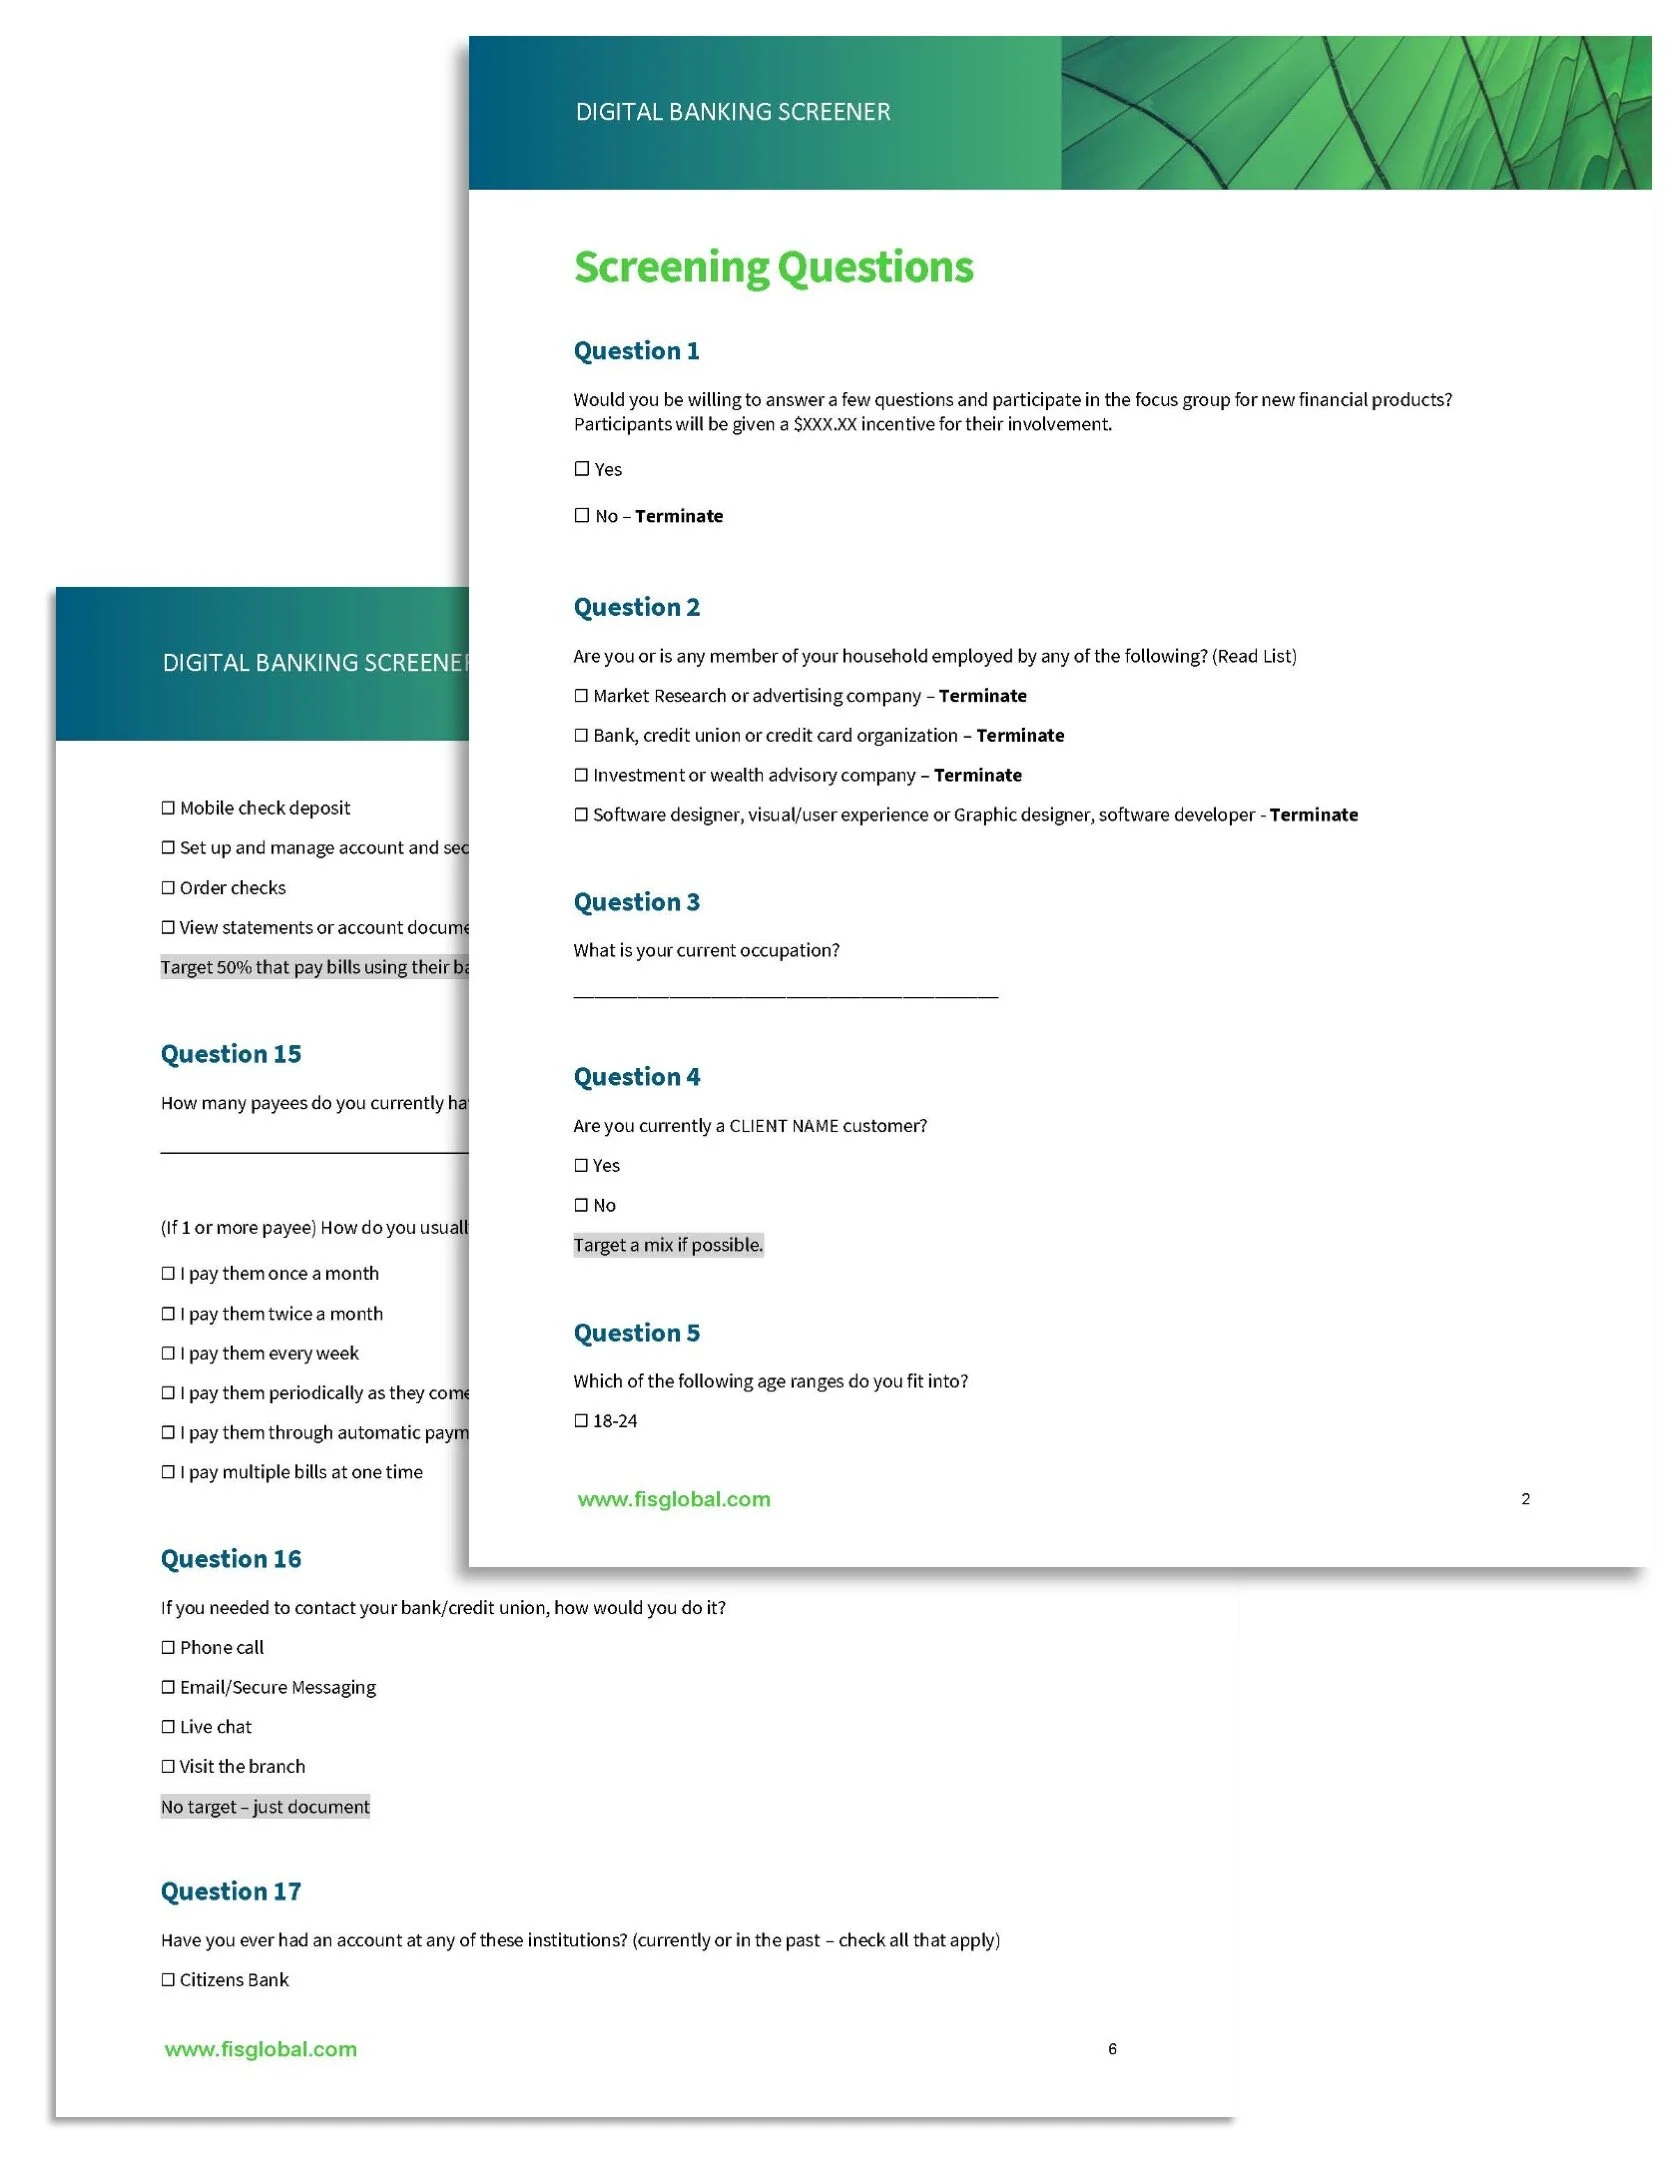
Excerpt from my survey/screener.
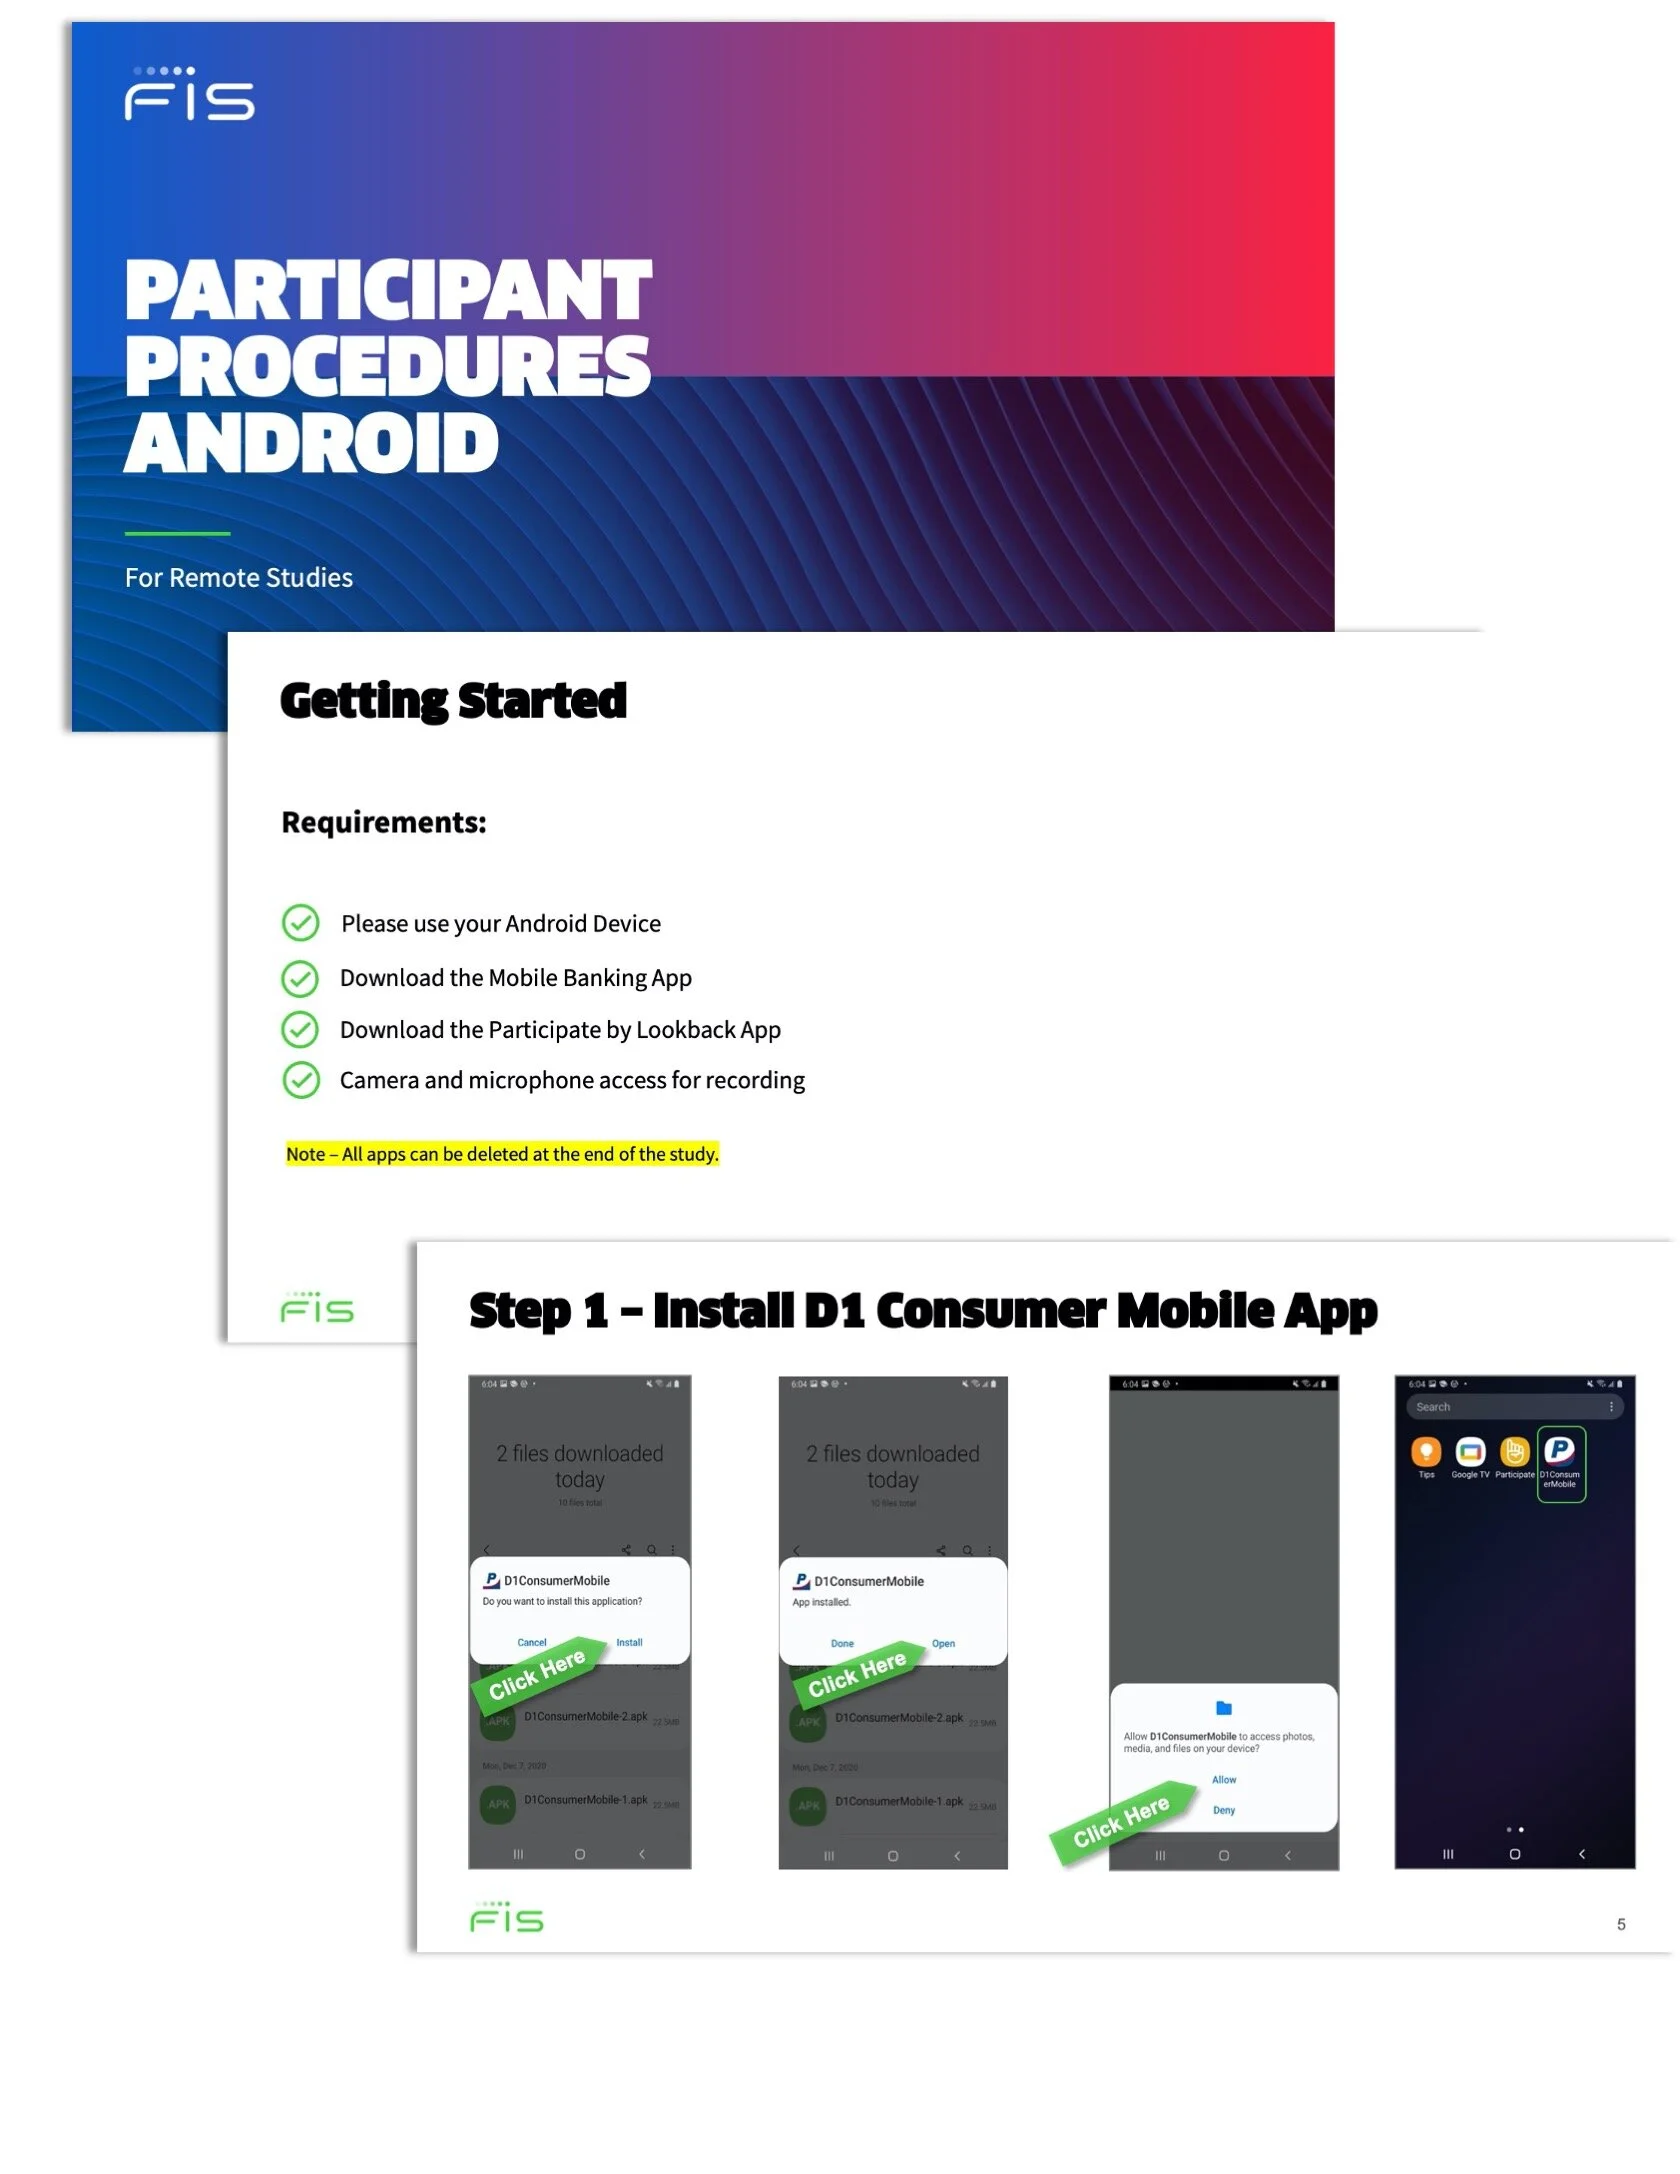
Excerpt from my participant on-boarding procedures.
Survey/Screener Analytics
I extracted the demographics and behavioral statistics from our survey/screener and cross-referenced them for microtrends. Our users were predominantly BoA, Chase, and CapitalOne users - a bias I would need to factor.
I was also able to gauge the importance of different financial activities and habits. The survey was great for gaining insight on dashboard needs and sensitivities.
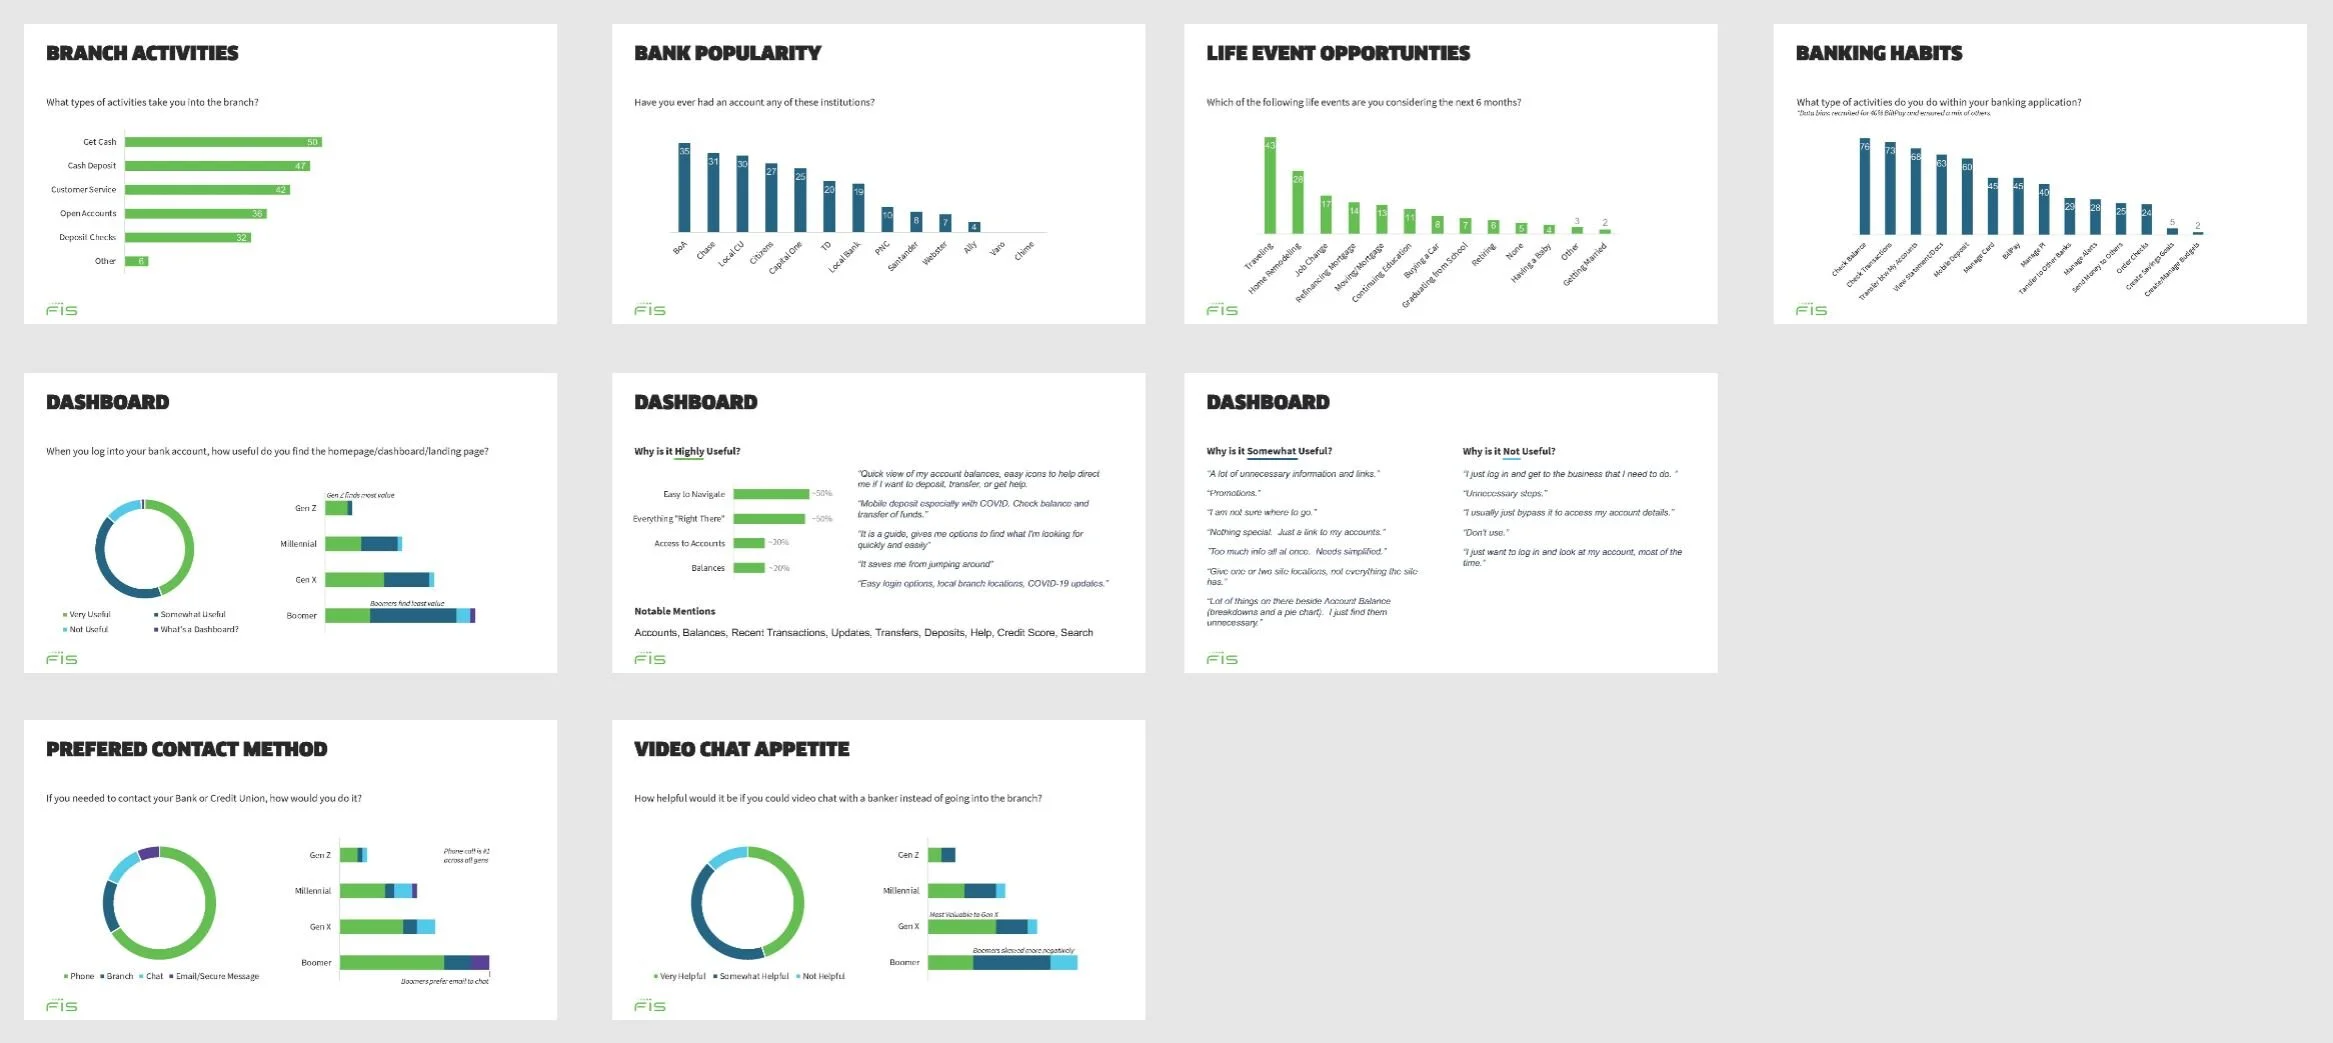
The screener is not just a filter, but can be used to gauge appetite, preferences, and habits as well.
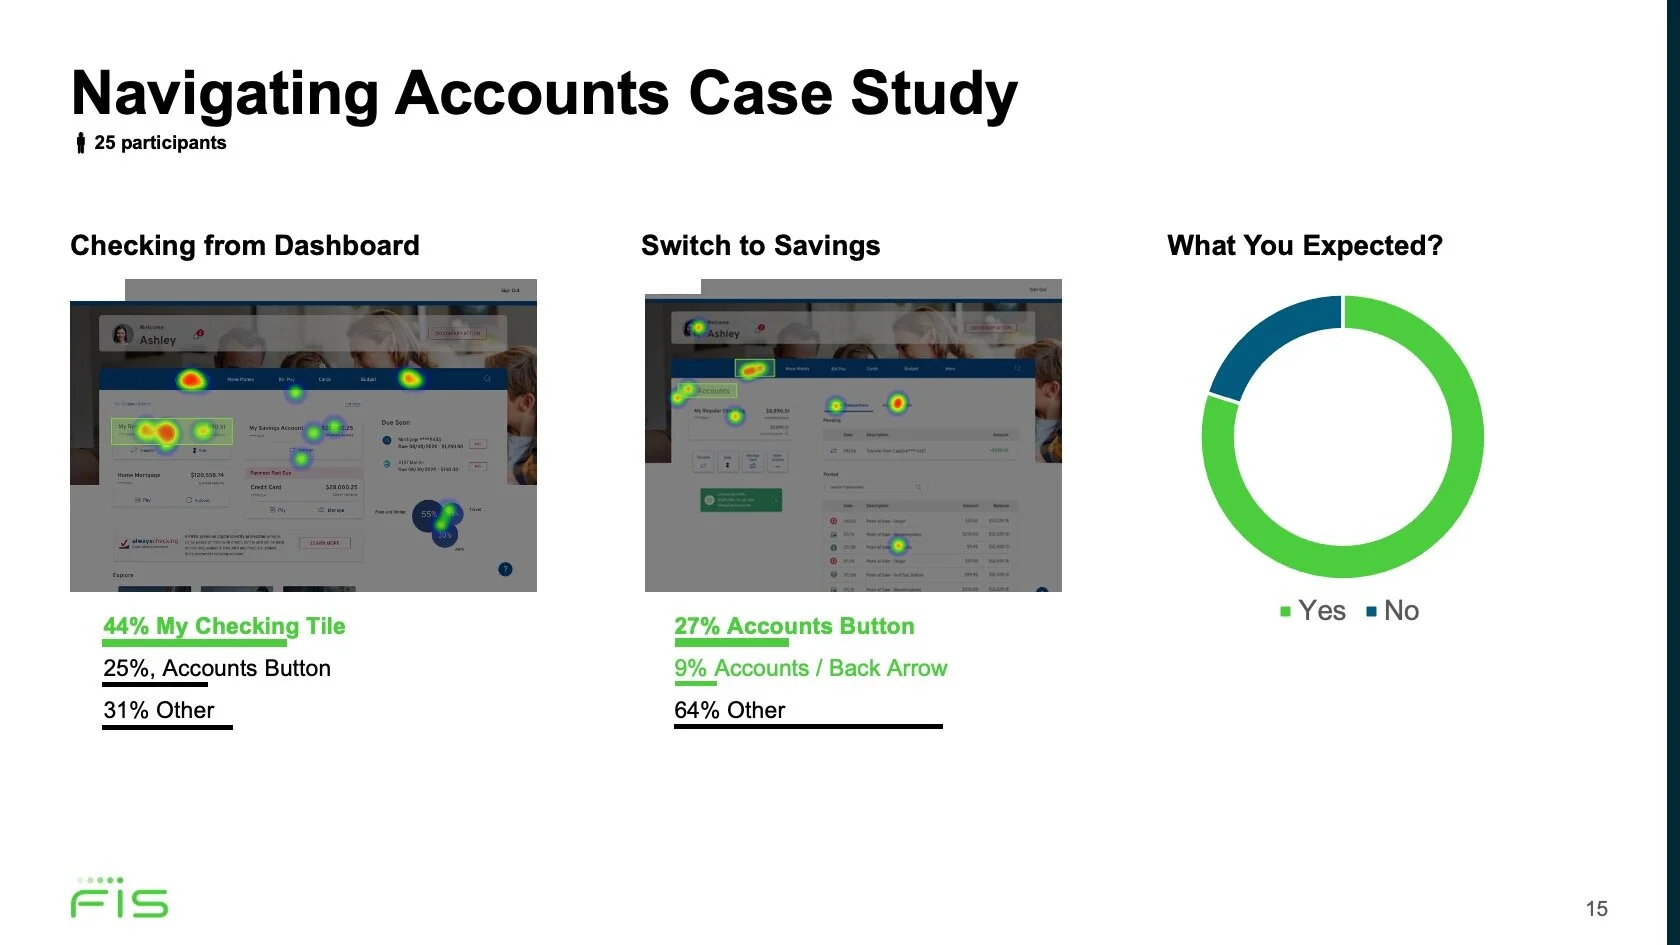
Remote Usability Testing
Tracey (Senior Creative Director) and I took turns moderating the tests each sprint in Lookback. We tested cross-platform (desktop/laptop/mobile) and cross-device (iPhone/Android/etc.). Clients observed the sessions and could chat with us while we moderated in real-time. I was also responsible for coordinating with the participants - scheduling, on-boarding, and trouble-shooting.
We conducted 6 to 8 testing sessions per sprint and each session was 30 minutes long. For each session, we first conducted a “mini-interview”: we asked contextual questions to better understand the user journeys particular and explore opportunities.
The remainder of the session, we conducted a usability test using the task-scenarios relevant to their device. We formatted the scripts to facilitate open-ended conversations around user expectations and impressions.
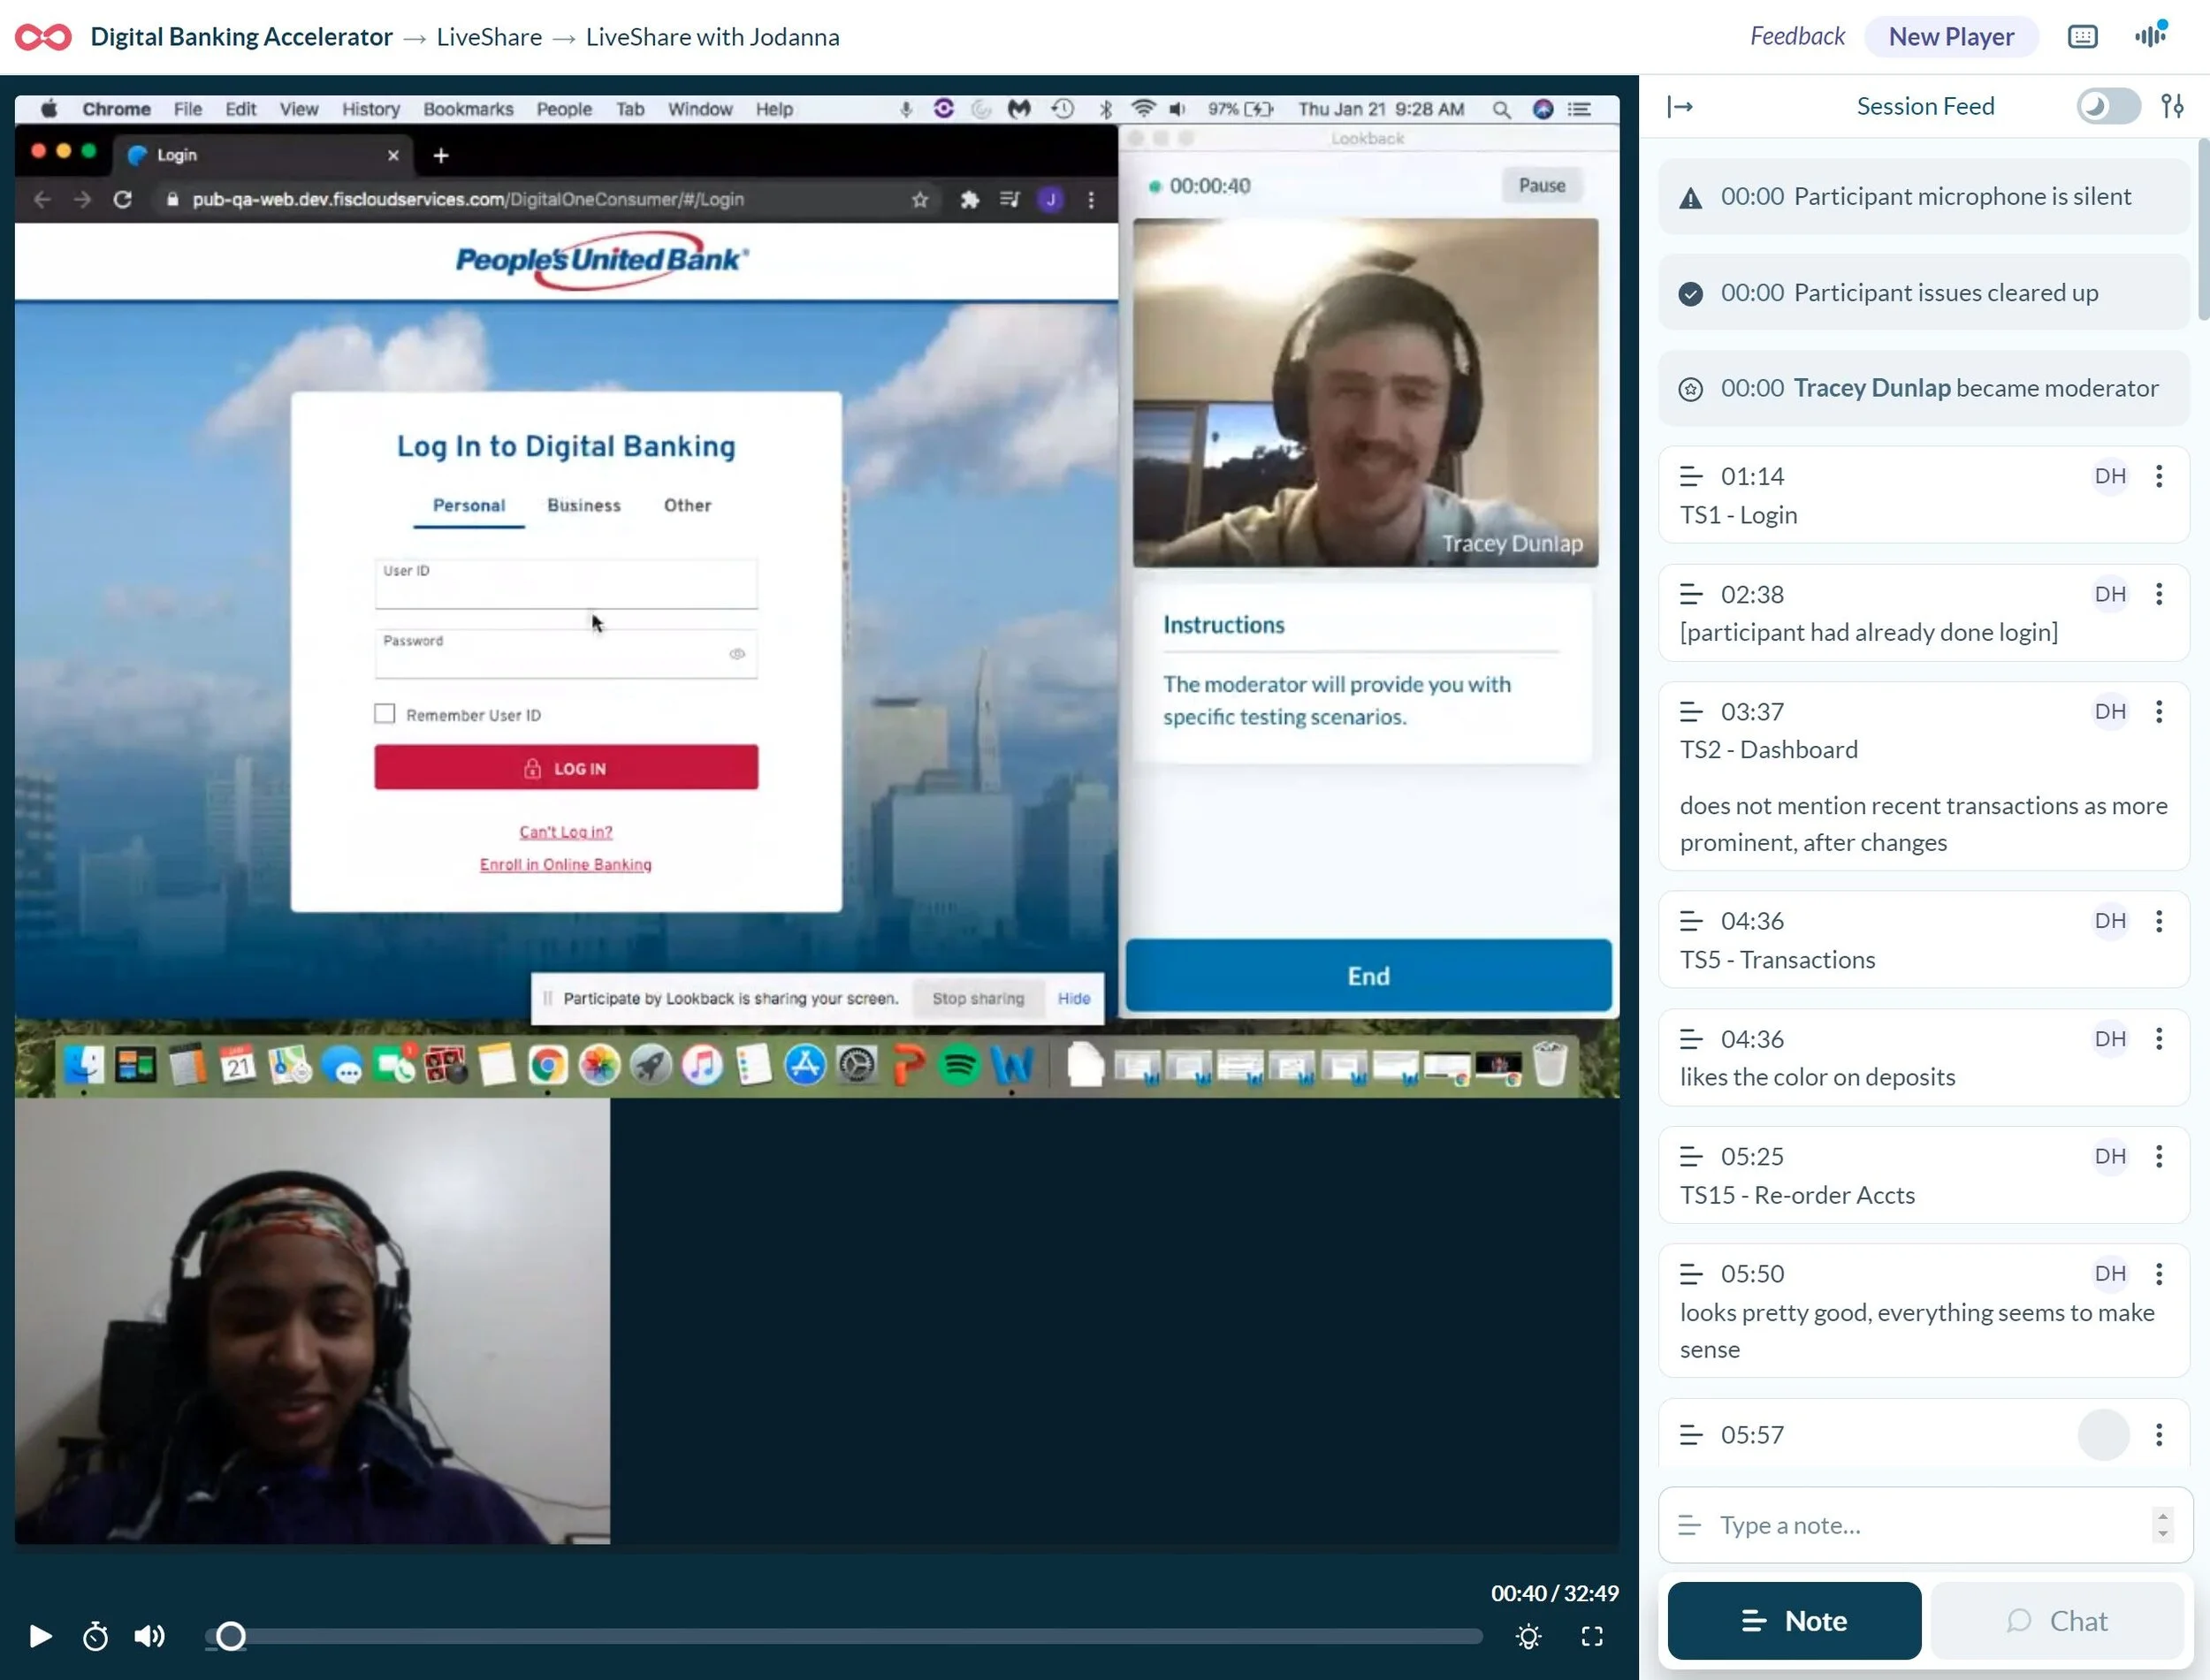
We moderated and recorded sessions in Lookback. For notes, I developed a system to flag our Task-Scenarios as well as other key metrics.
6 Minds Data Dissection
After each round of testing, I transferred salient notes on participant behavior to our research board. I organized the notes in terms of underlying psychological roots (the 6 minds) and looked for related interactions. I pulled out key statistics on our metrics as well as exemplary quotes. I then identified our definitive issues and graded them on a severity-scale. I reviewed my findings and recommendations with our team and we deliberated on refinements and next-steps.
The beauty of the 6 minds method was that it was collaborative. Sometimes it was not exactly clear why a feature is misunderstood. By debating the psychological properties of interactions as a team, we were able to unearth root causes of issues.
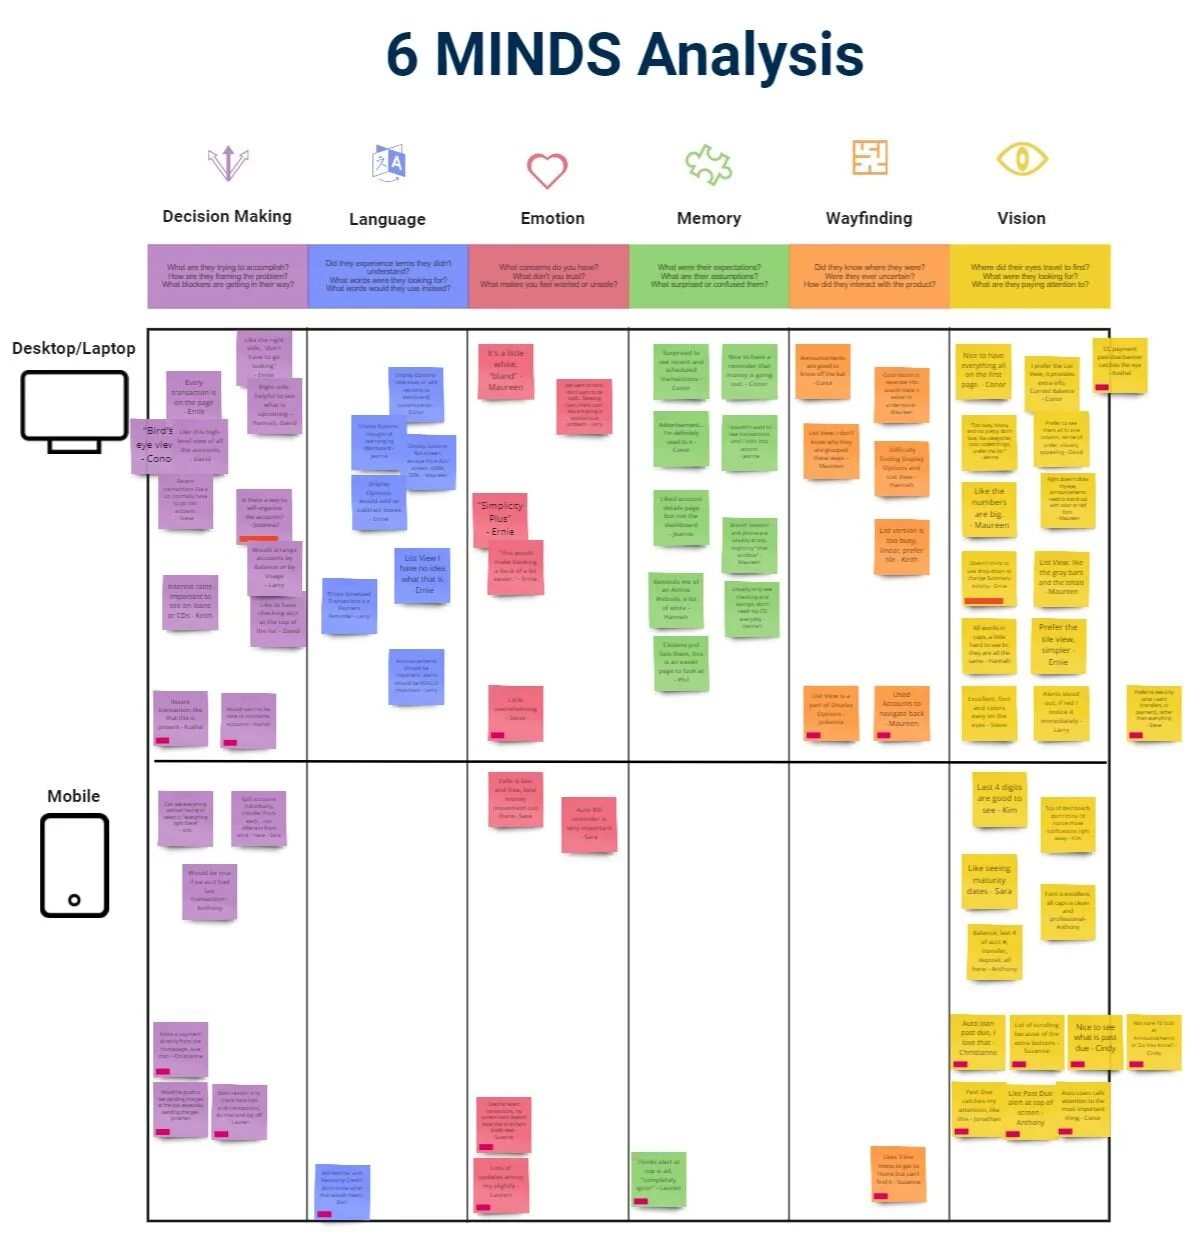
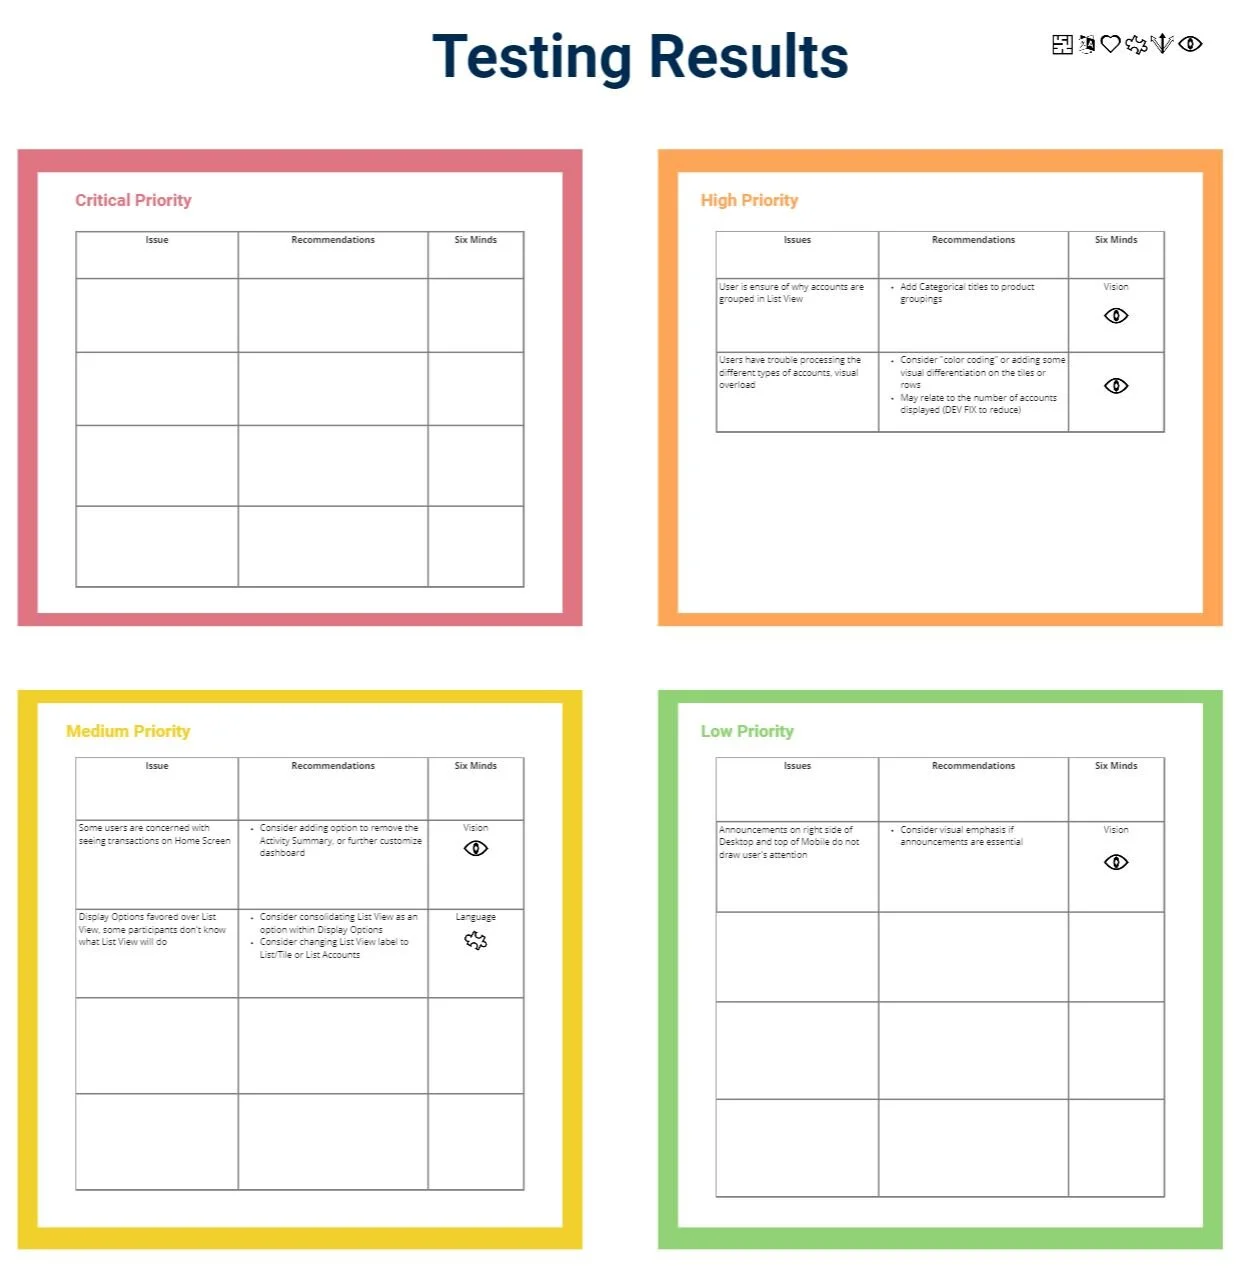
Our Testing Results diagnosed issues in terms of their psychological origins and recommended solutions appropriately.
Results and Reporting
At the conclusion of each sprint, I crafted a progress report to review and present our findings to the client.
My goal in research is to let the data speak for itself; in each progress report I included:
An overview of what we tested and why
Summary pain-points and prominent interactions
Competitive research
Corroborating data from previous tests and card sorts
Behavioral trends and stats
Prominent quotes
Exemplary video clips
I then presented the client with issues ranked by severity and options for next steps and opportunities for future testing.
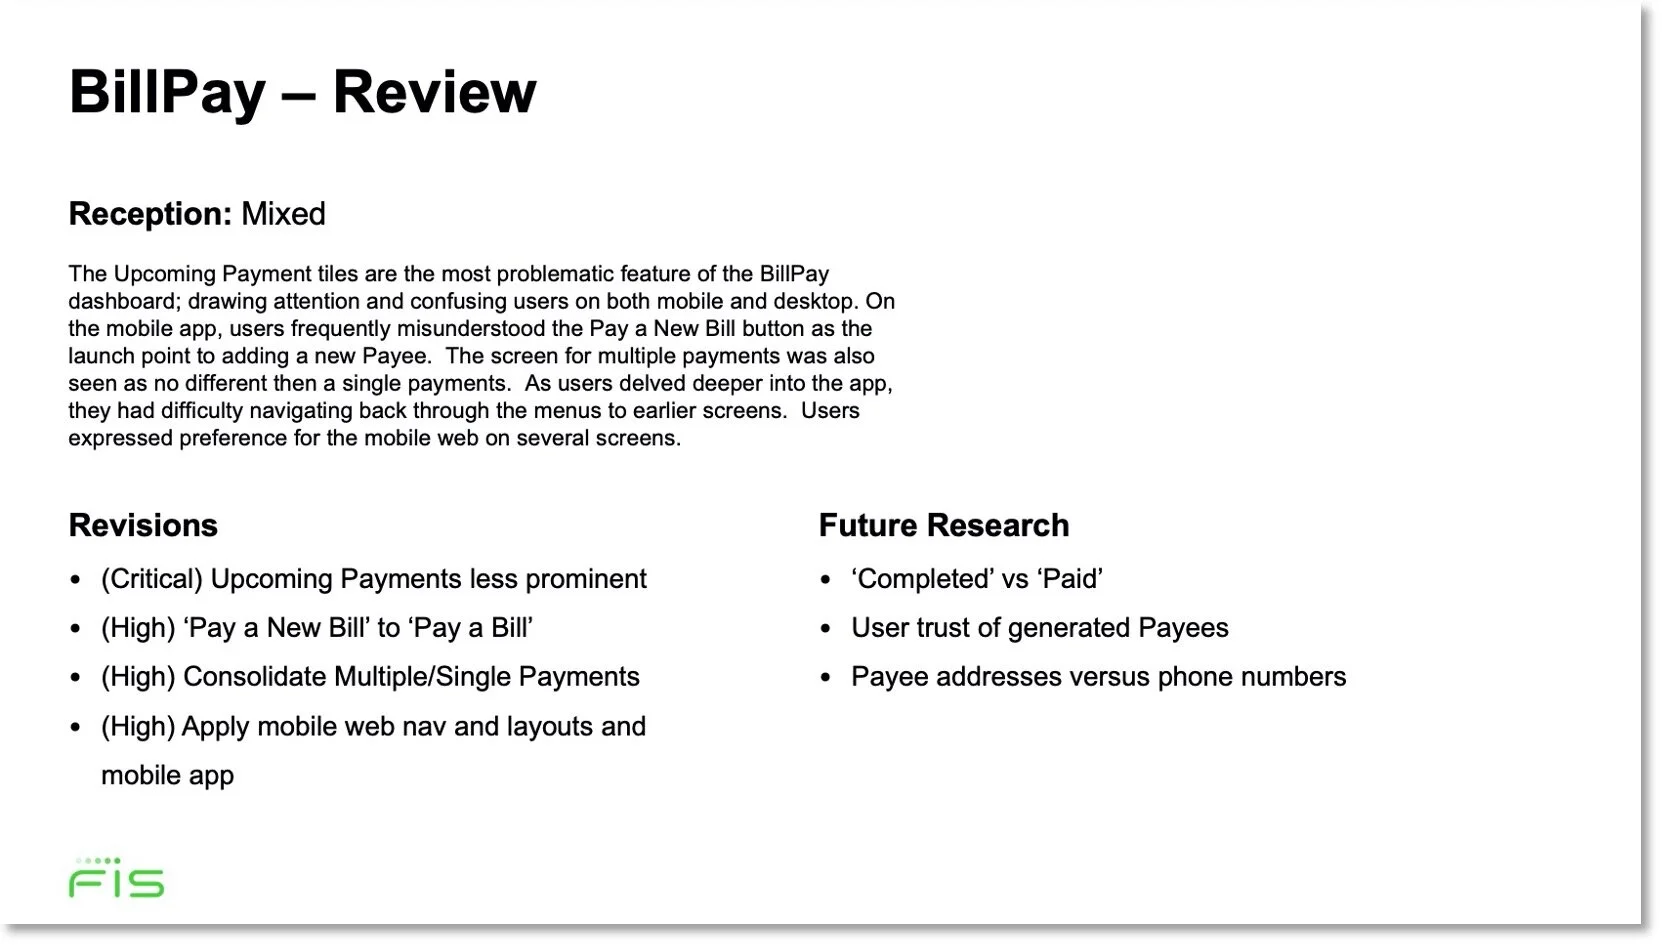
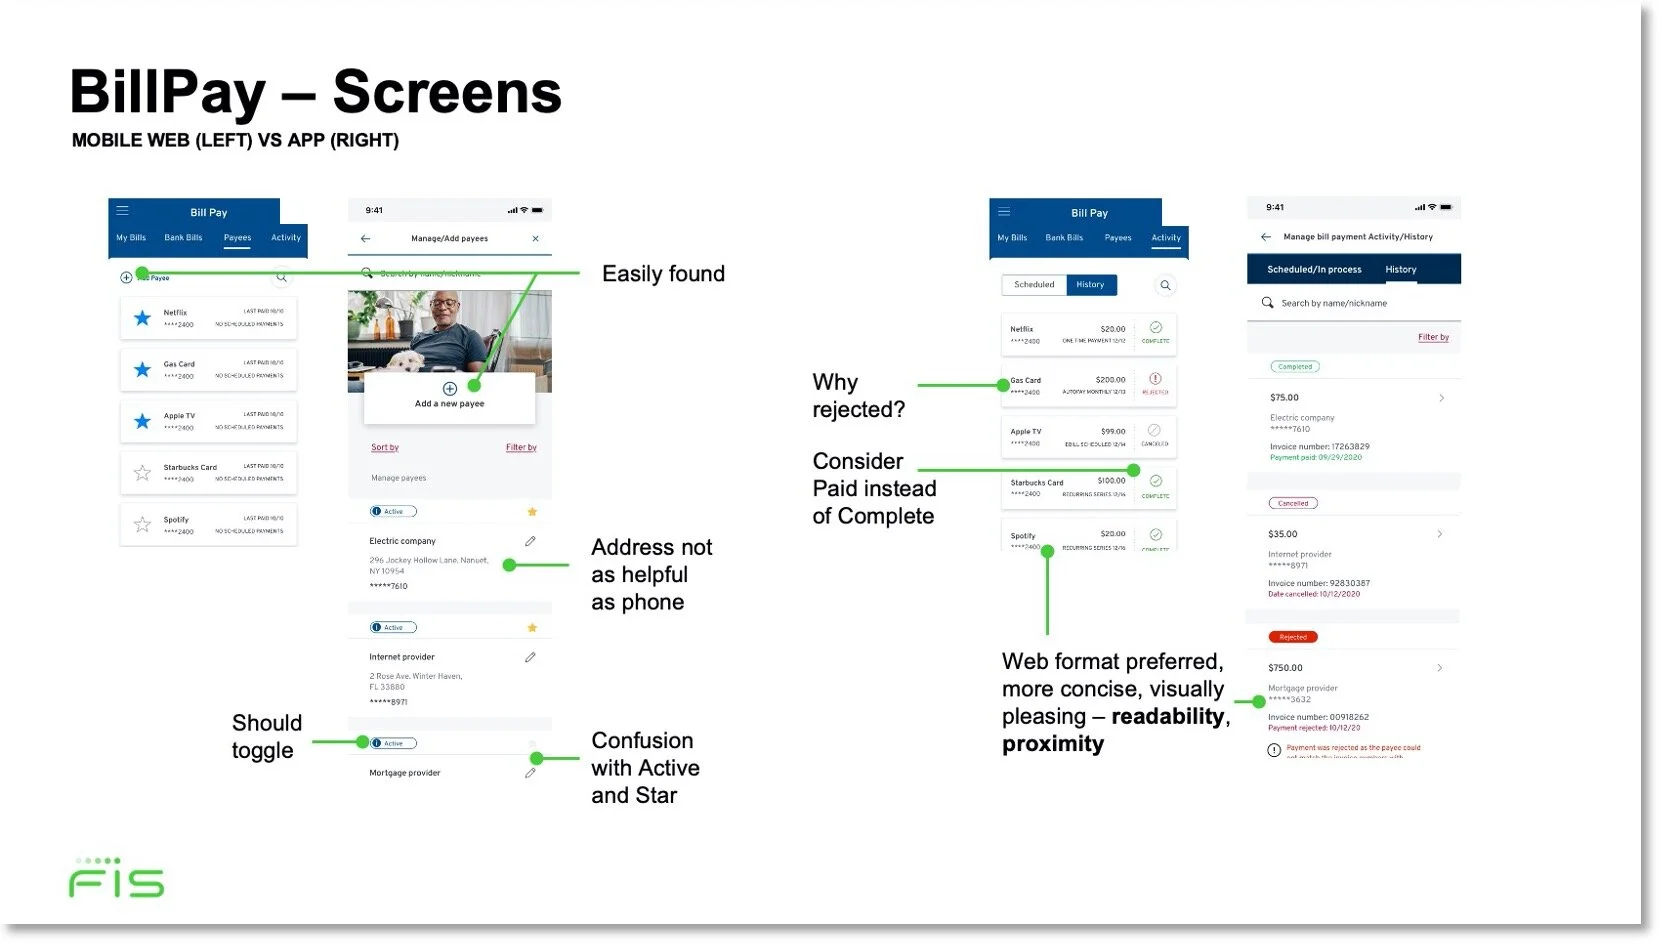
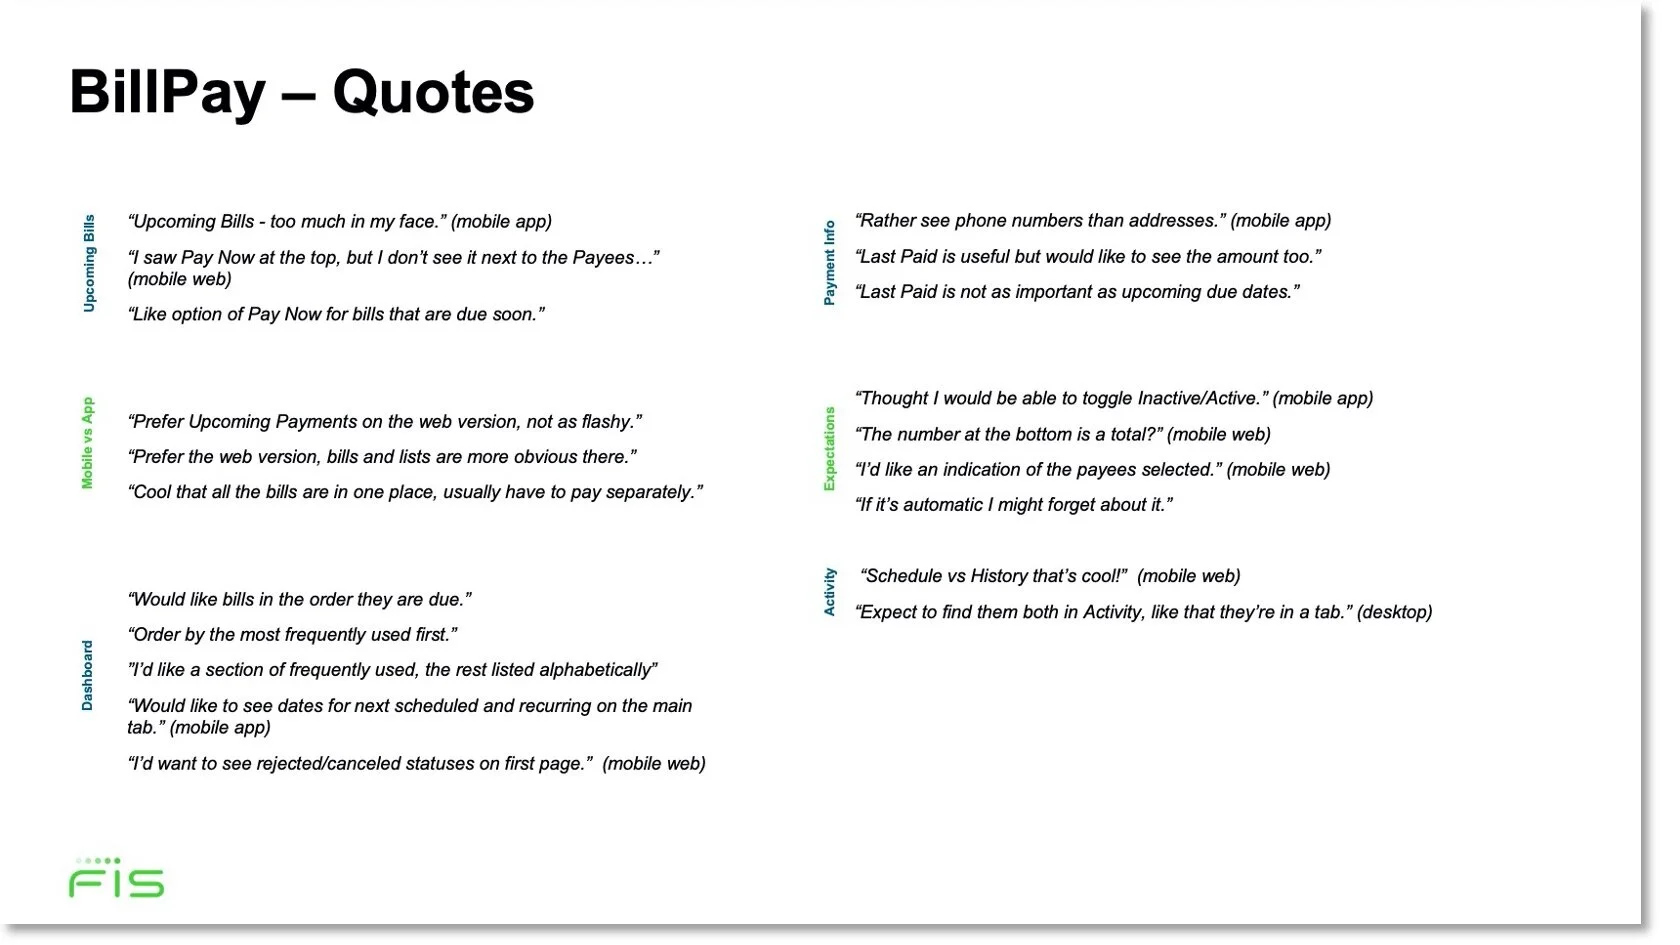
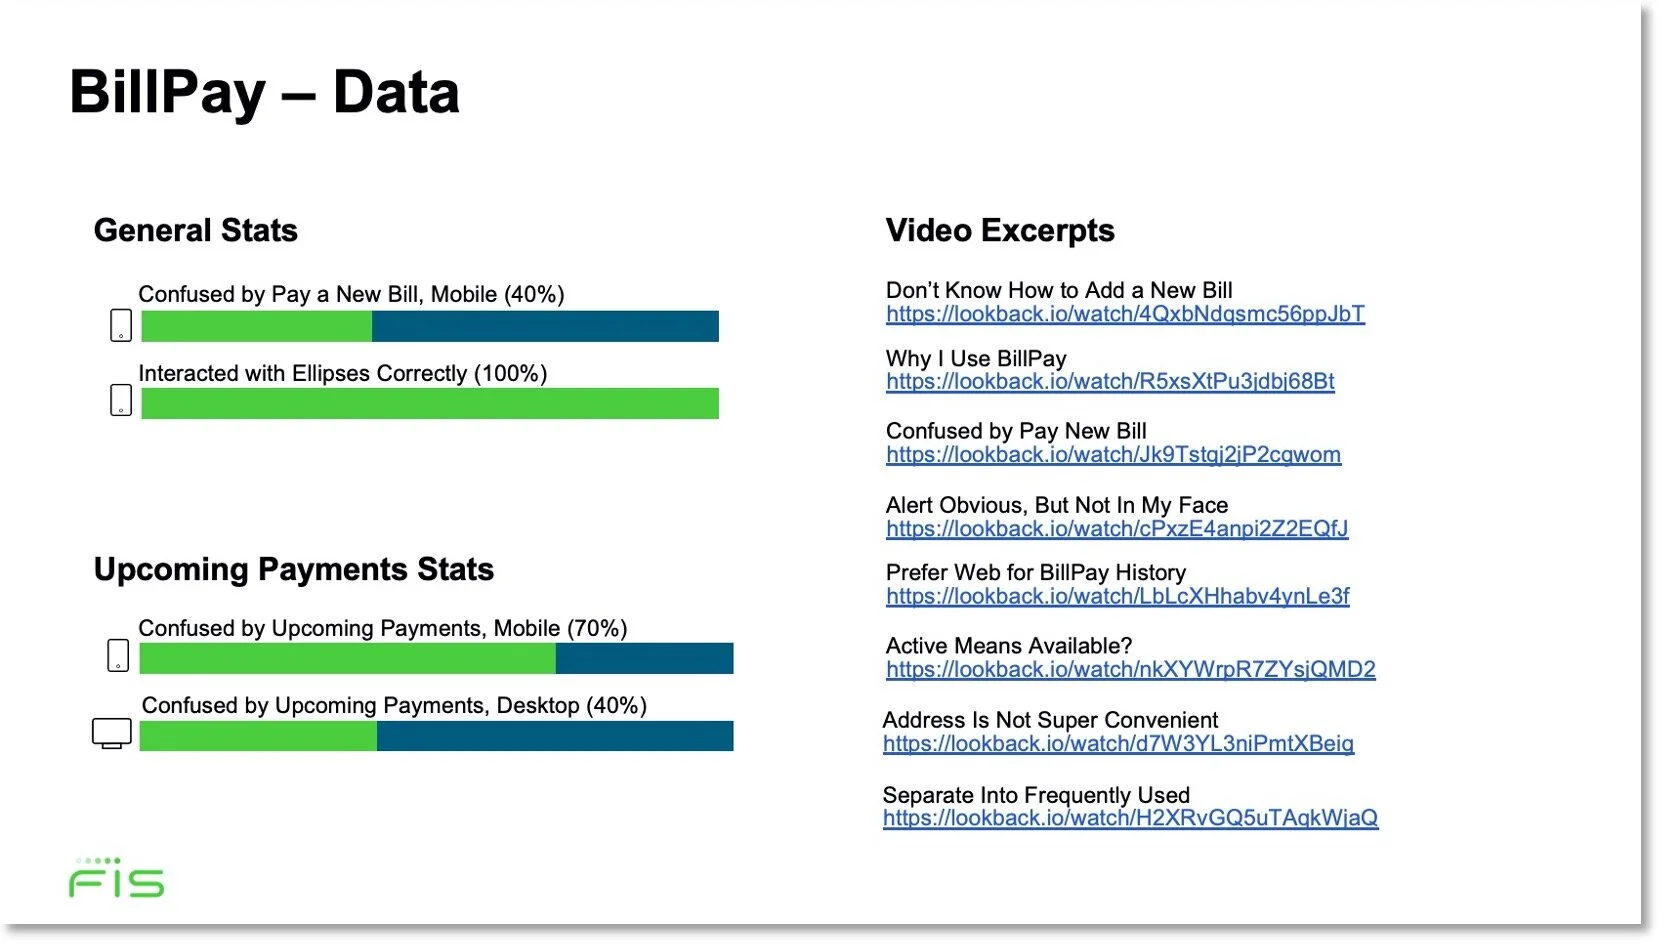
Excerpts from my progress report on BillPay. In BillPay and Transfers, users struggled with the navigation, readability, and visibility of the native app in comparison to the mobile web. This led to a hybridization of the two platforms to reduce code and optimize the experience.
Revisions and Iteration
Product refinement doesn’t happen in a vacuum. As we tested, we revised our designs with input from product, development, and the client. The dashboard in particular underwent the most scrutiny as it was relevant to the user journeys with the most impact.
Our first iteration of the dashboard performed well, but did not surprise or delight in any positive way. The second iteration was more visually pleasing and efficient, but users felt the design lacked utility (the quick action buttons were removed for all accounts except the primary account). In the third iteration, we added personalization options to re-arrange accounts and add functionality - which was well-received but could be more obvious.
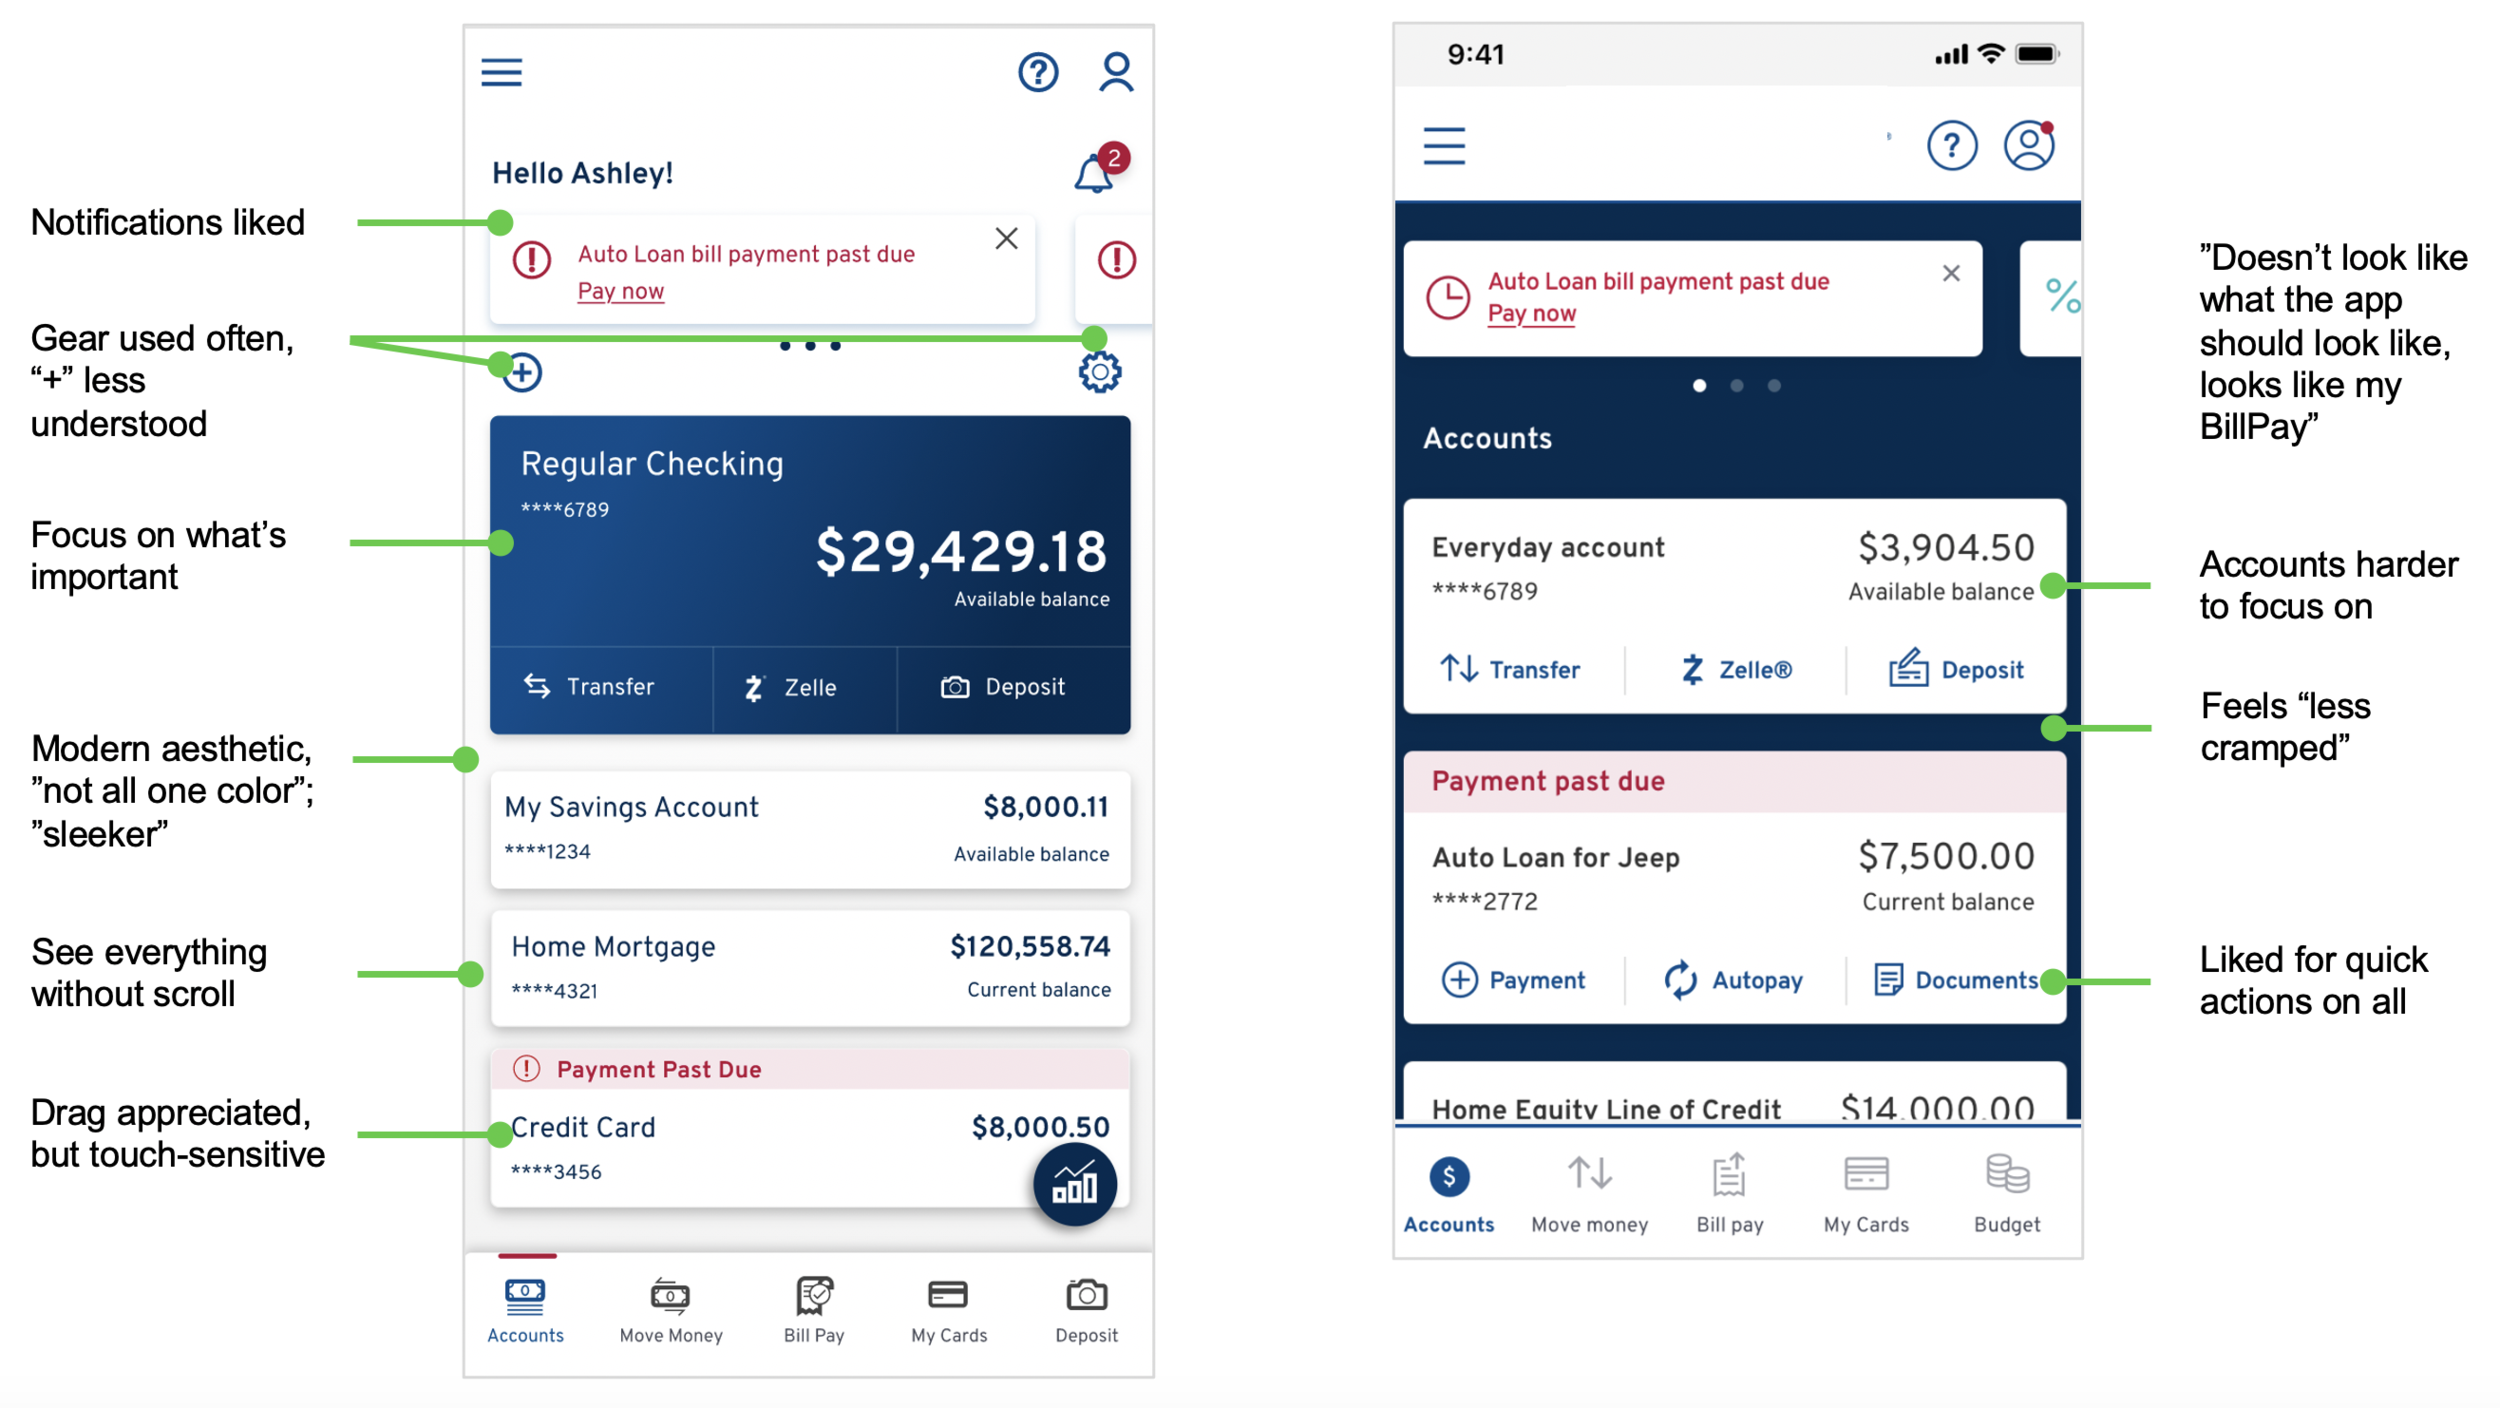
Dashboard 2nd Iteration (Left) and 1st Iteration (Right)
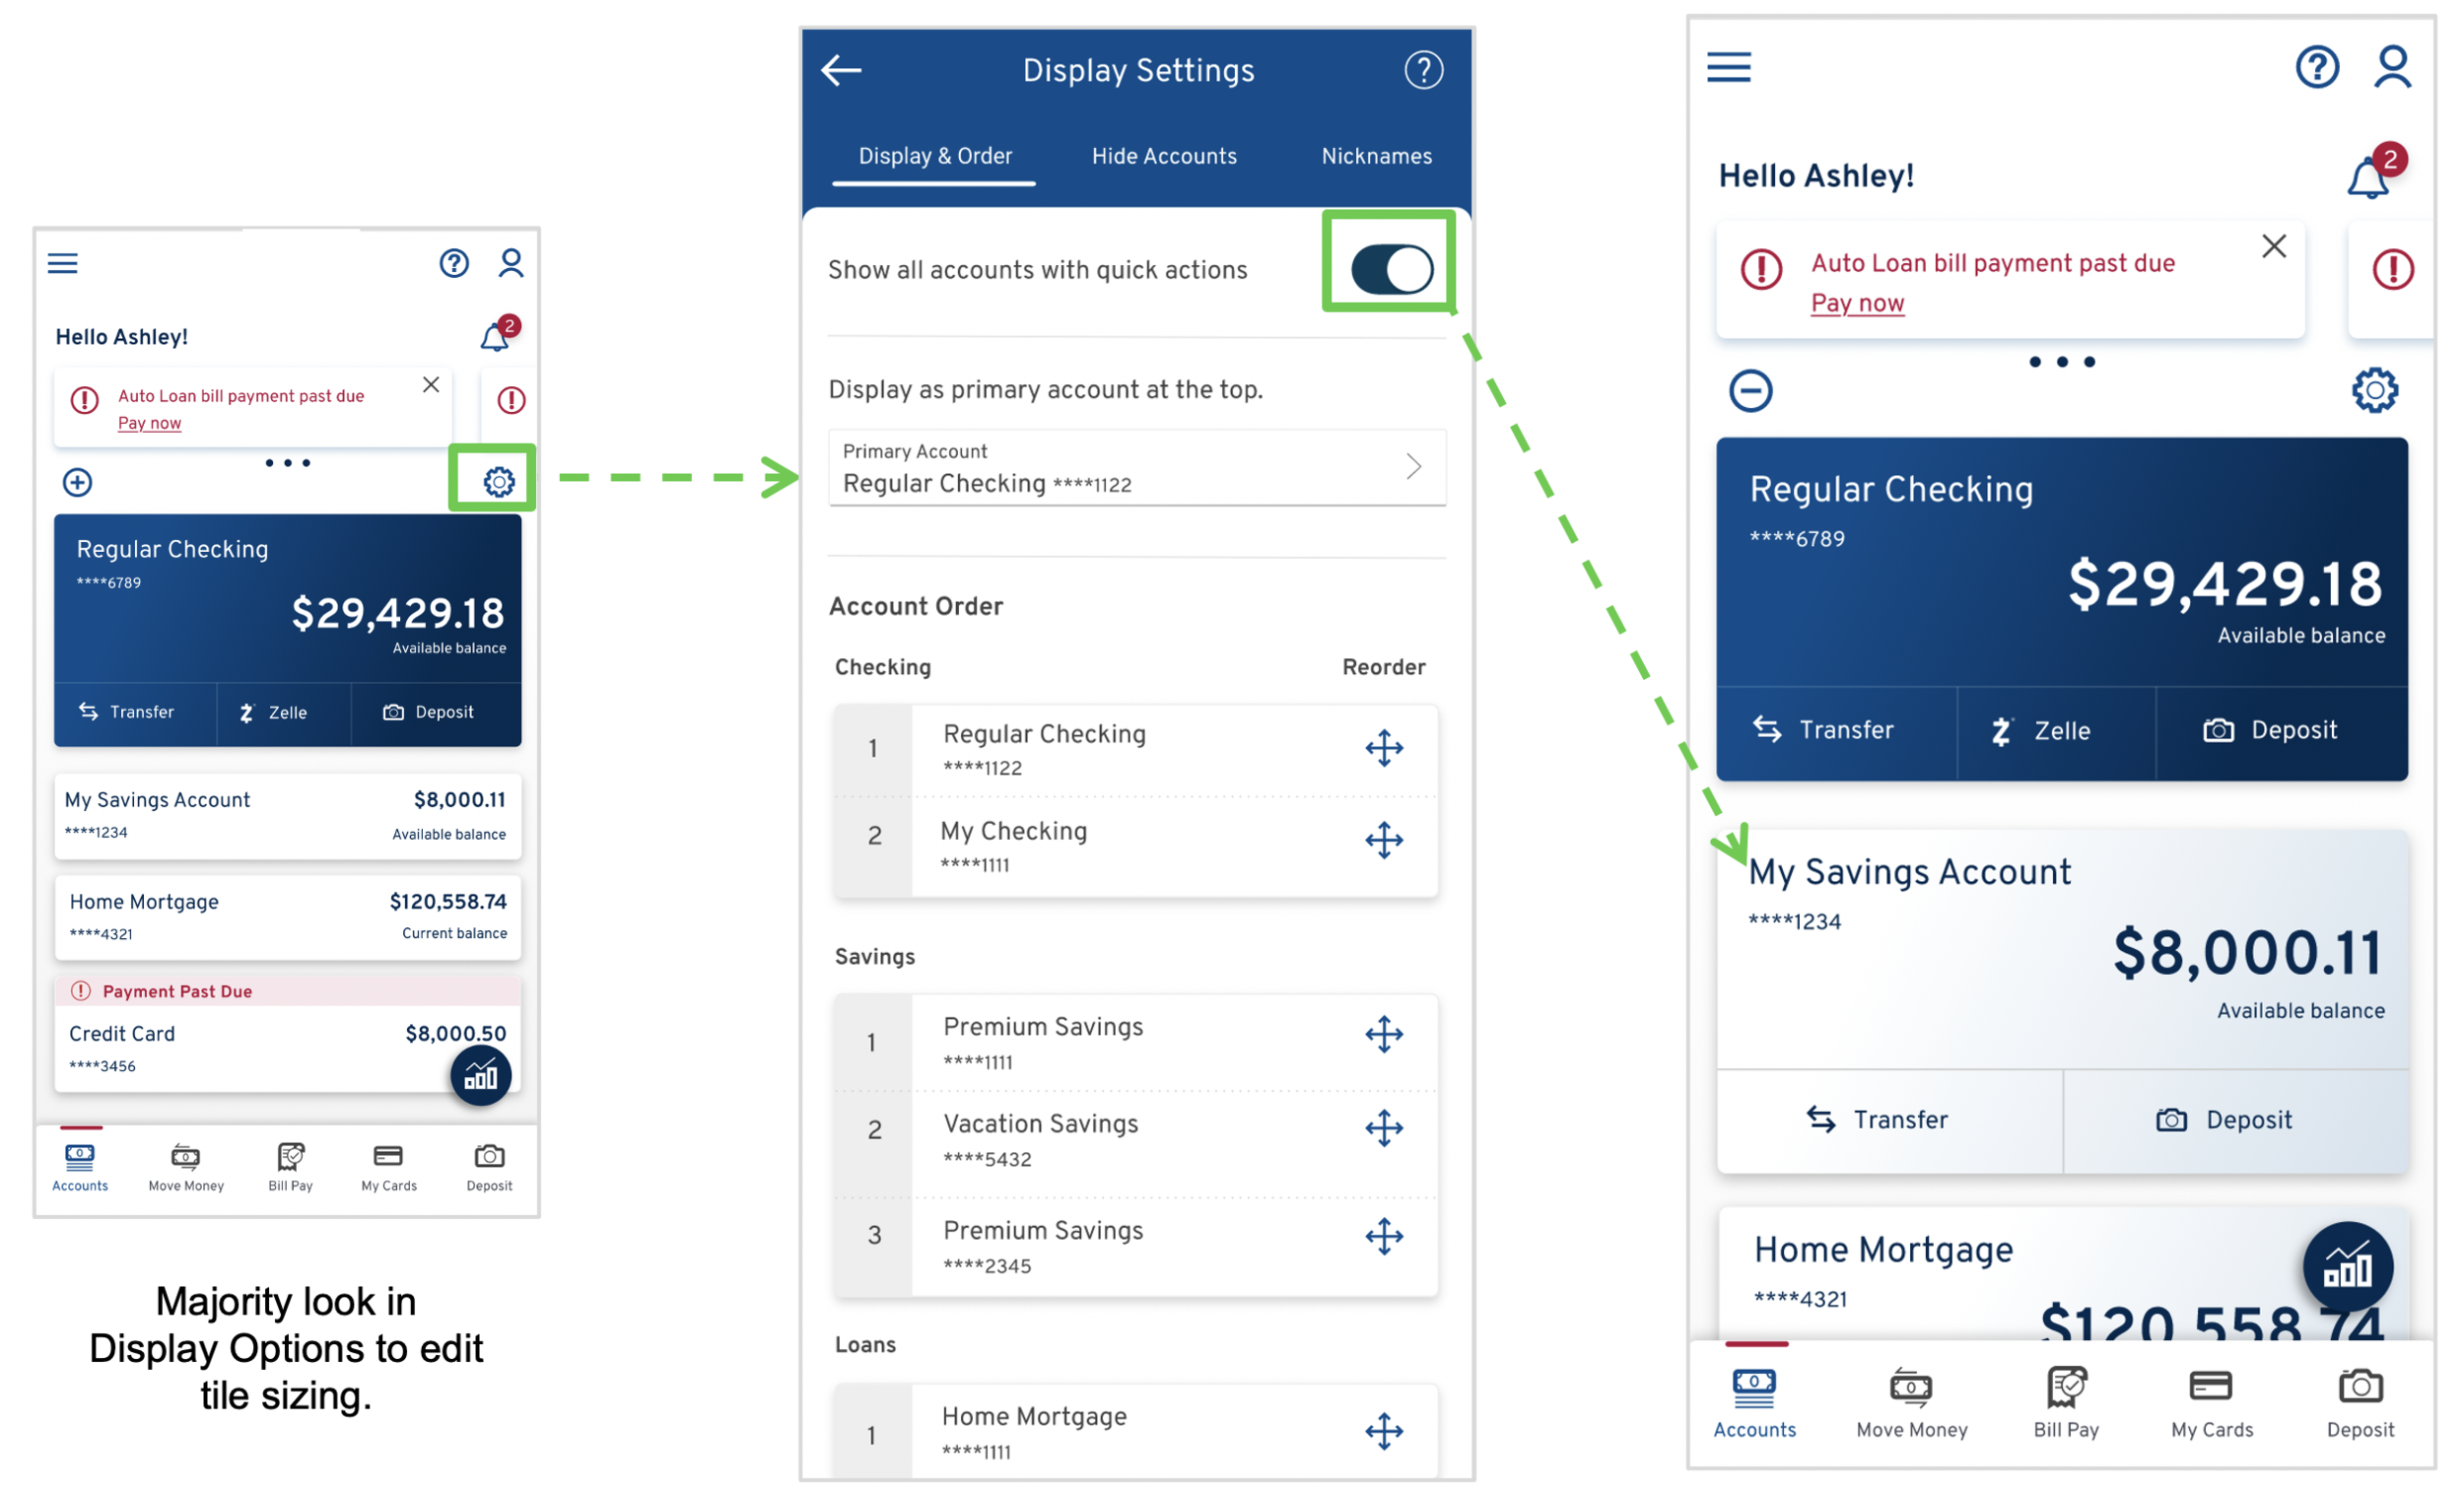
Dashboard 3rd Iteration
Conclusion
After a series of 7 sprints, we conducted a comprehensive series of 25 hour-long study sessions to test our refinements.
The design improvements we made not only optimized the client platform, but elevated the performance of our core product as well (as they were harvested back). In addition, I standardized a robust strategy for in-sprint user testing - which our sales team was eager to get a hold of. I provided an overview and price estimates for them to share with current and prospective clients.
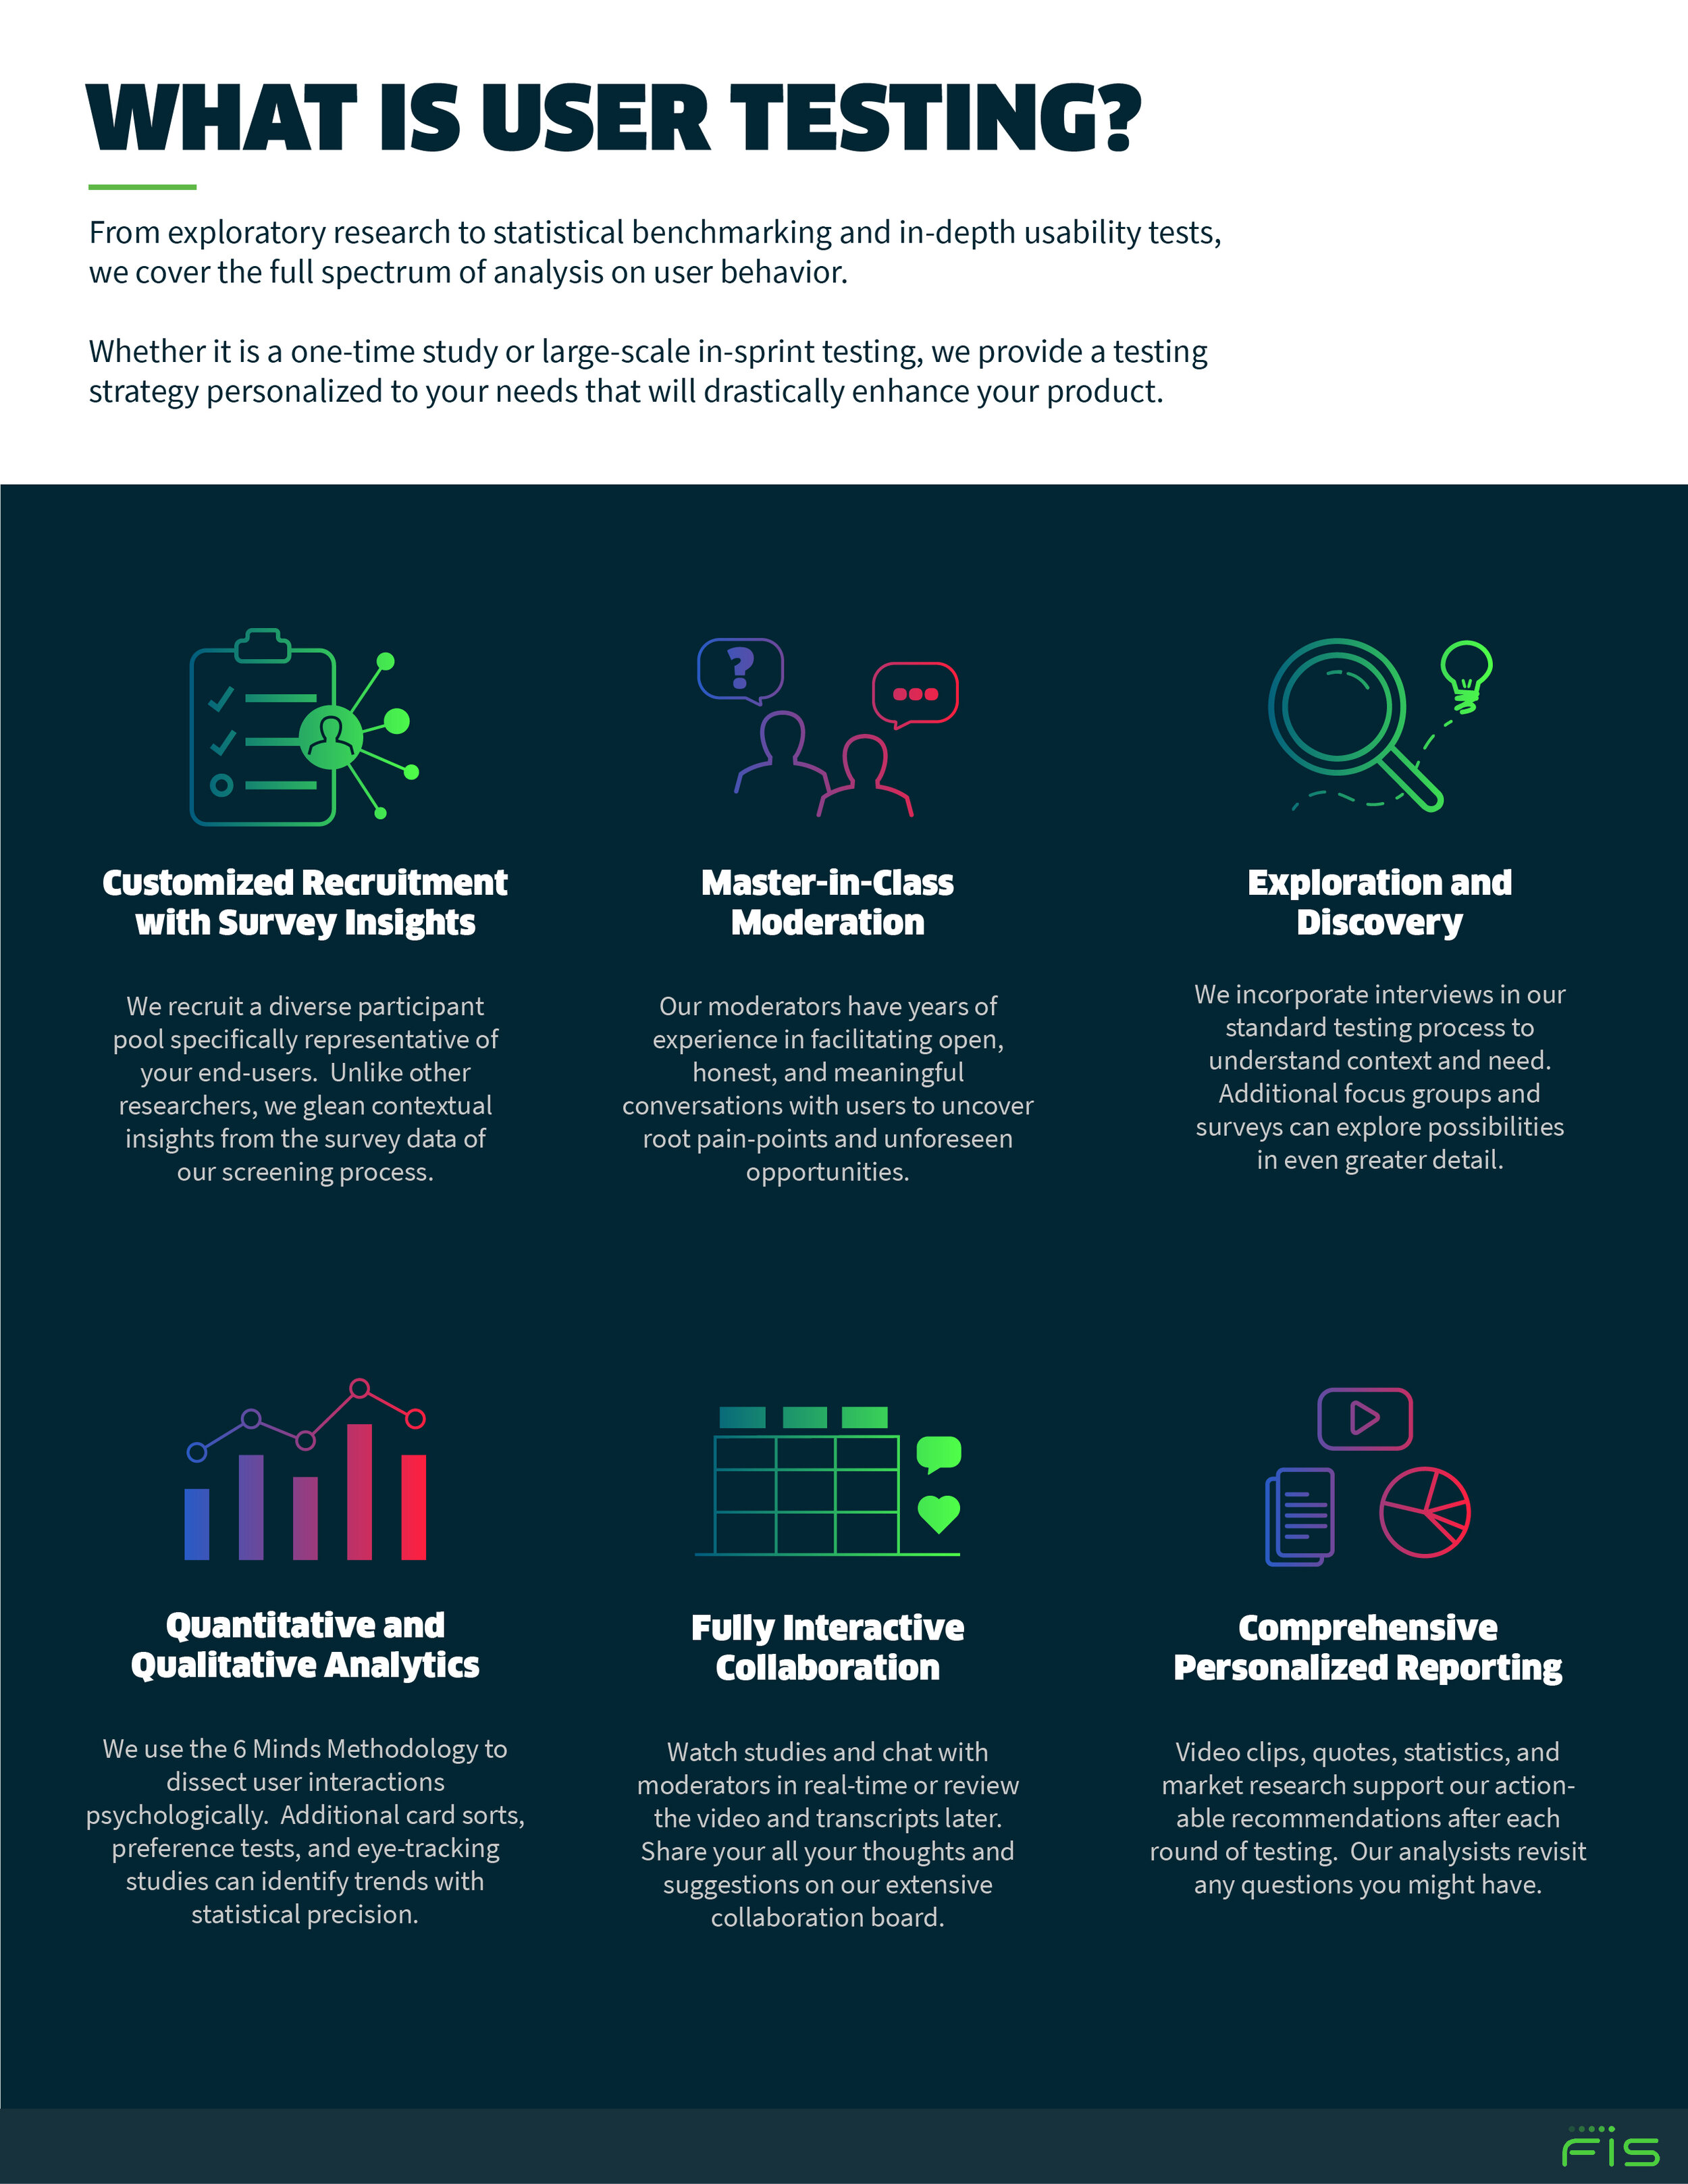
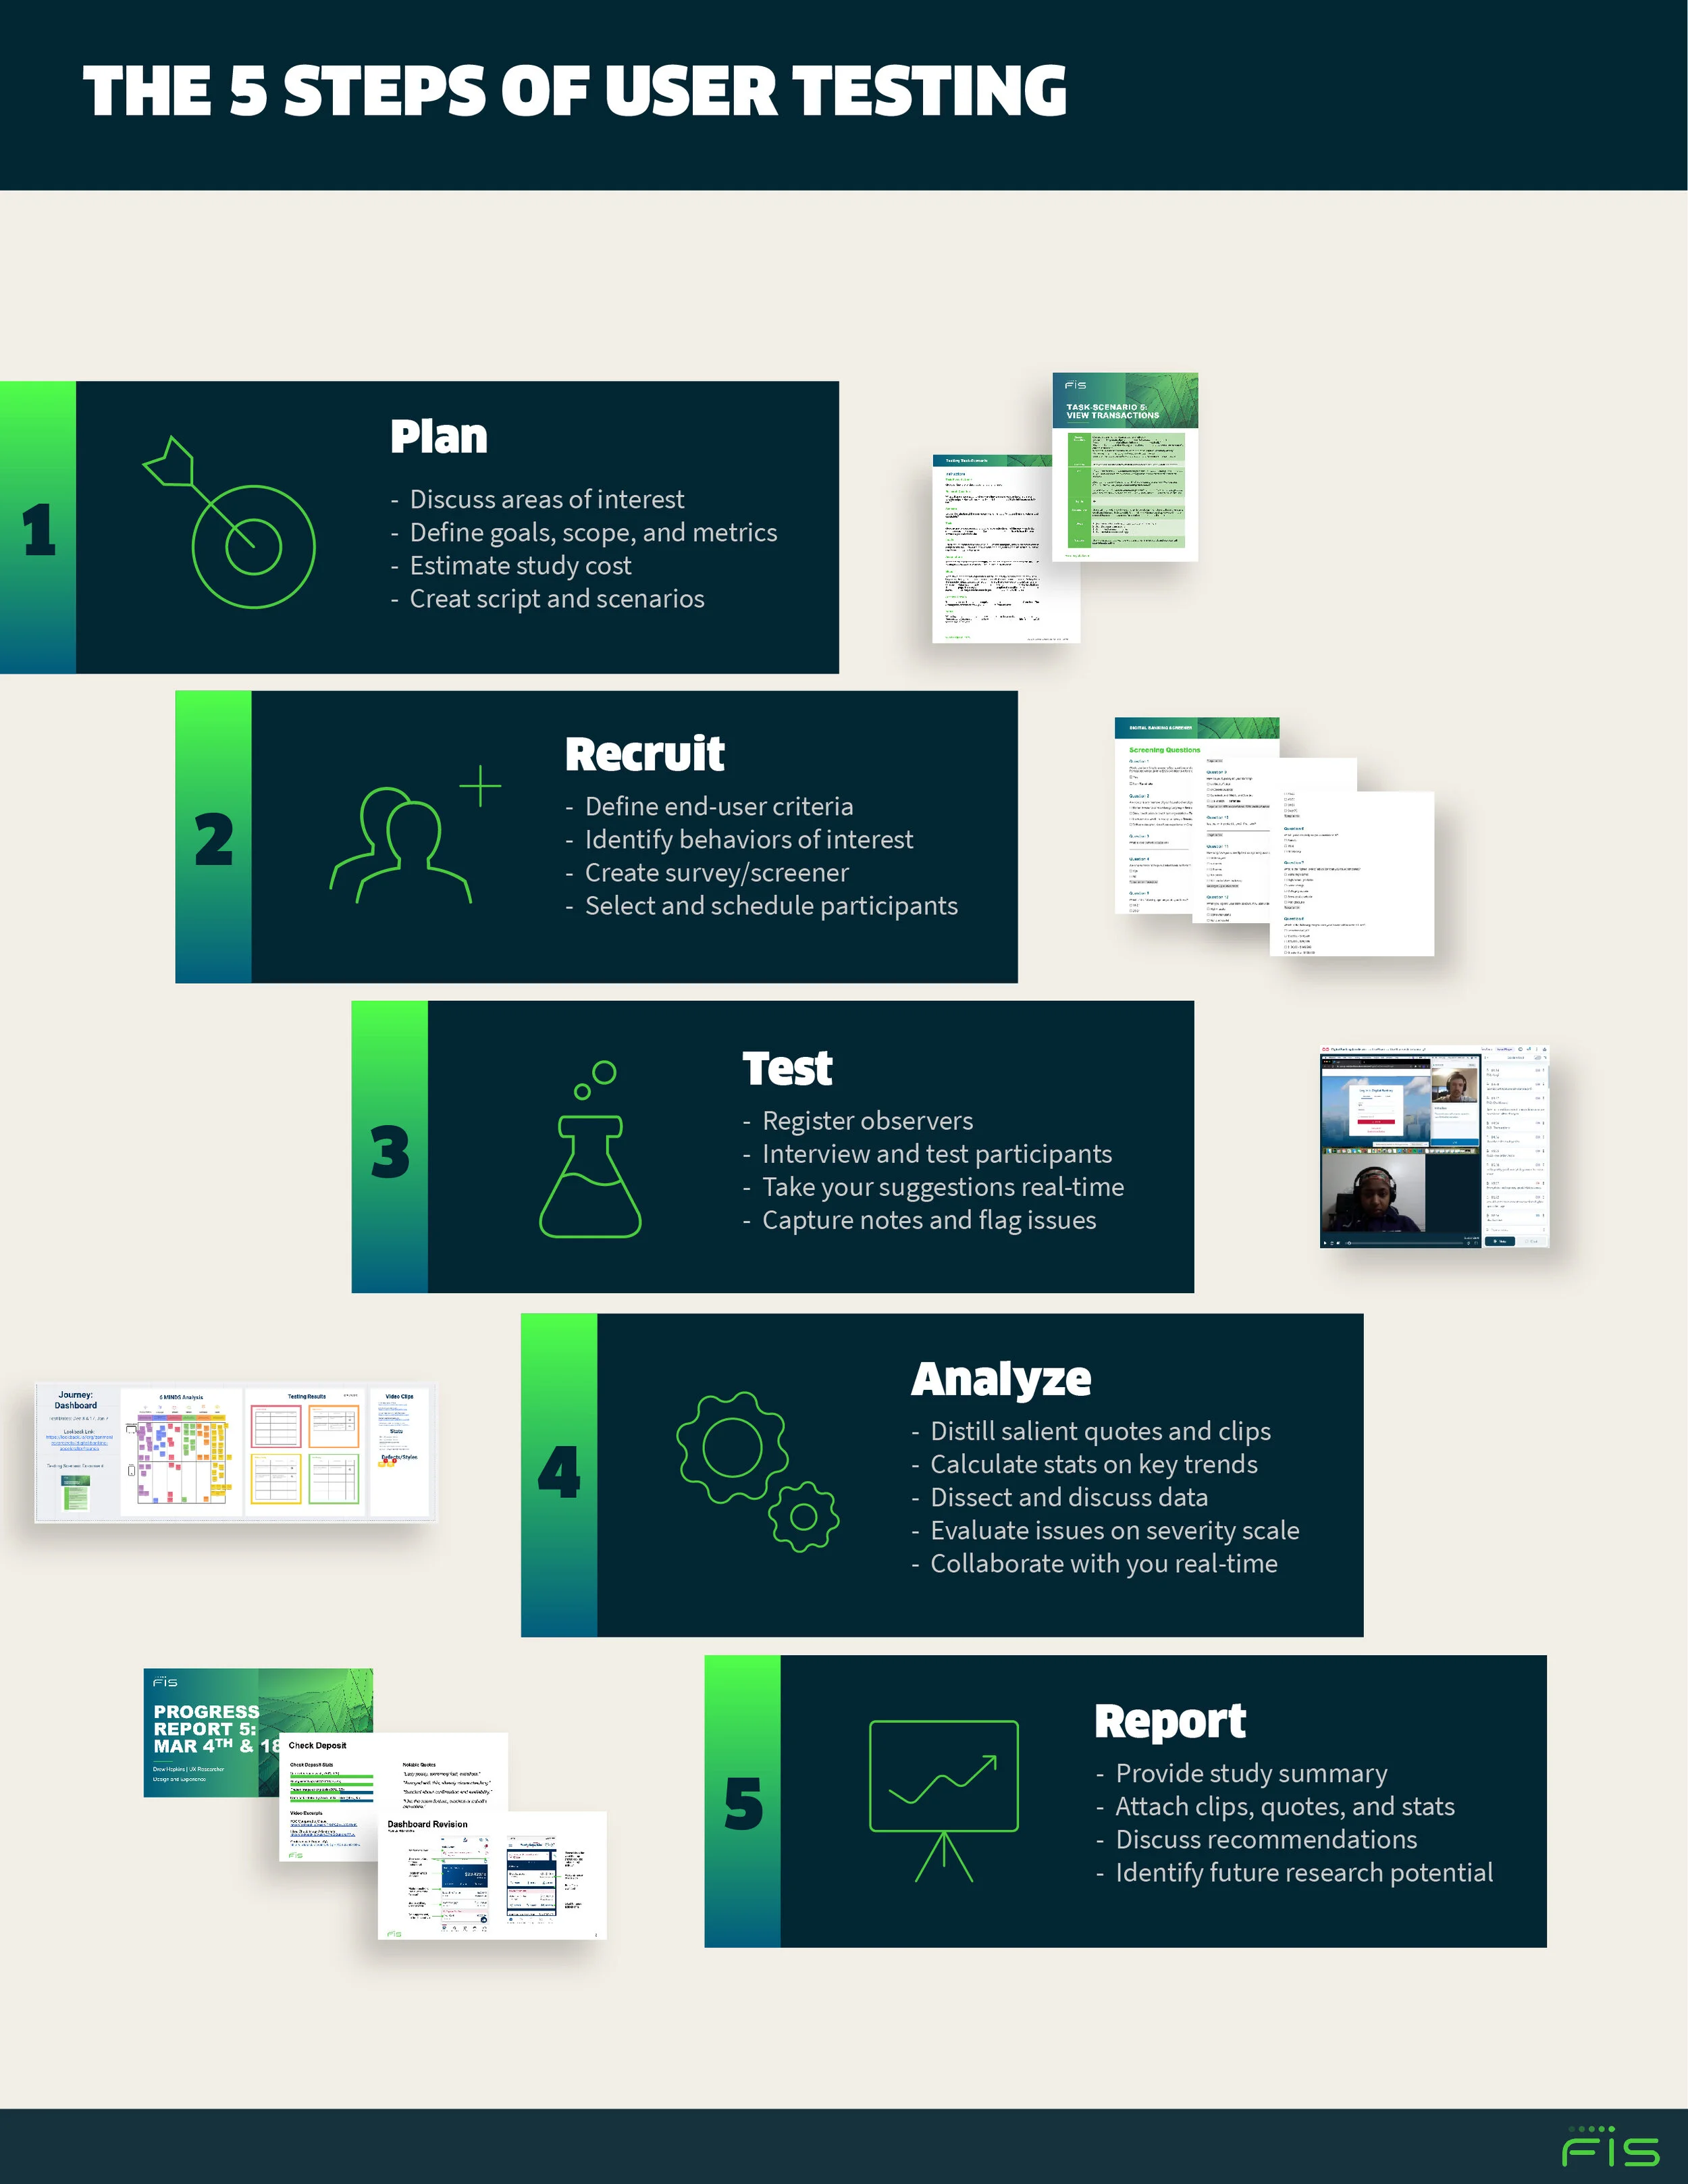
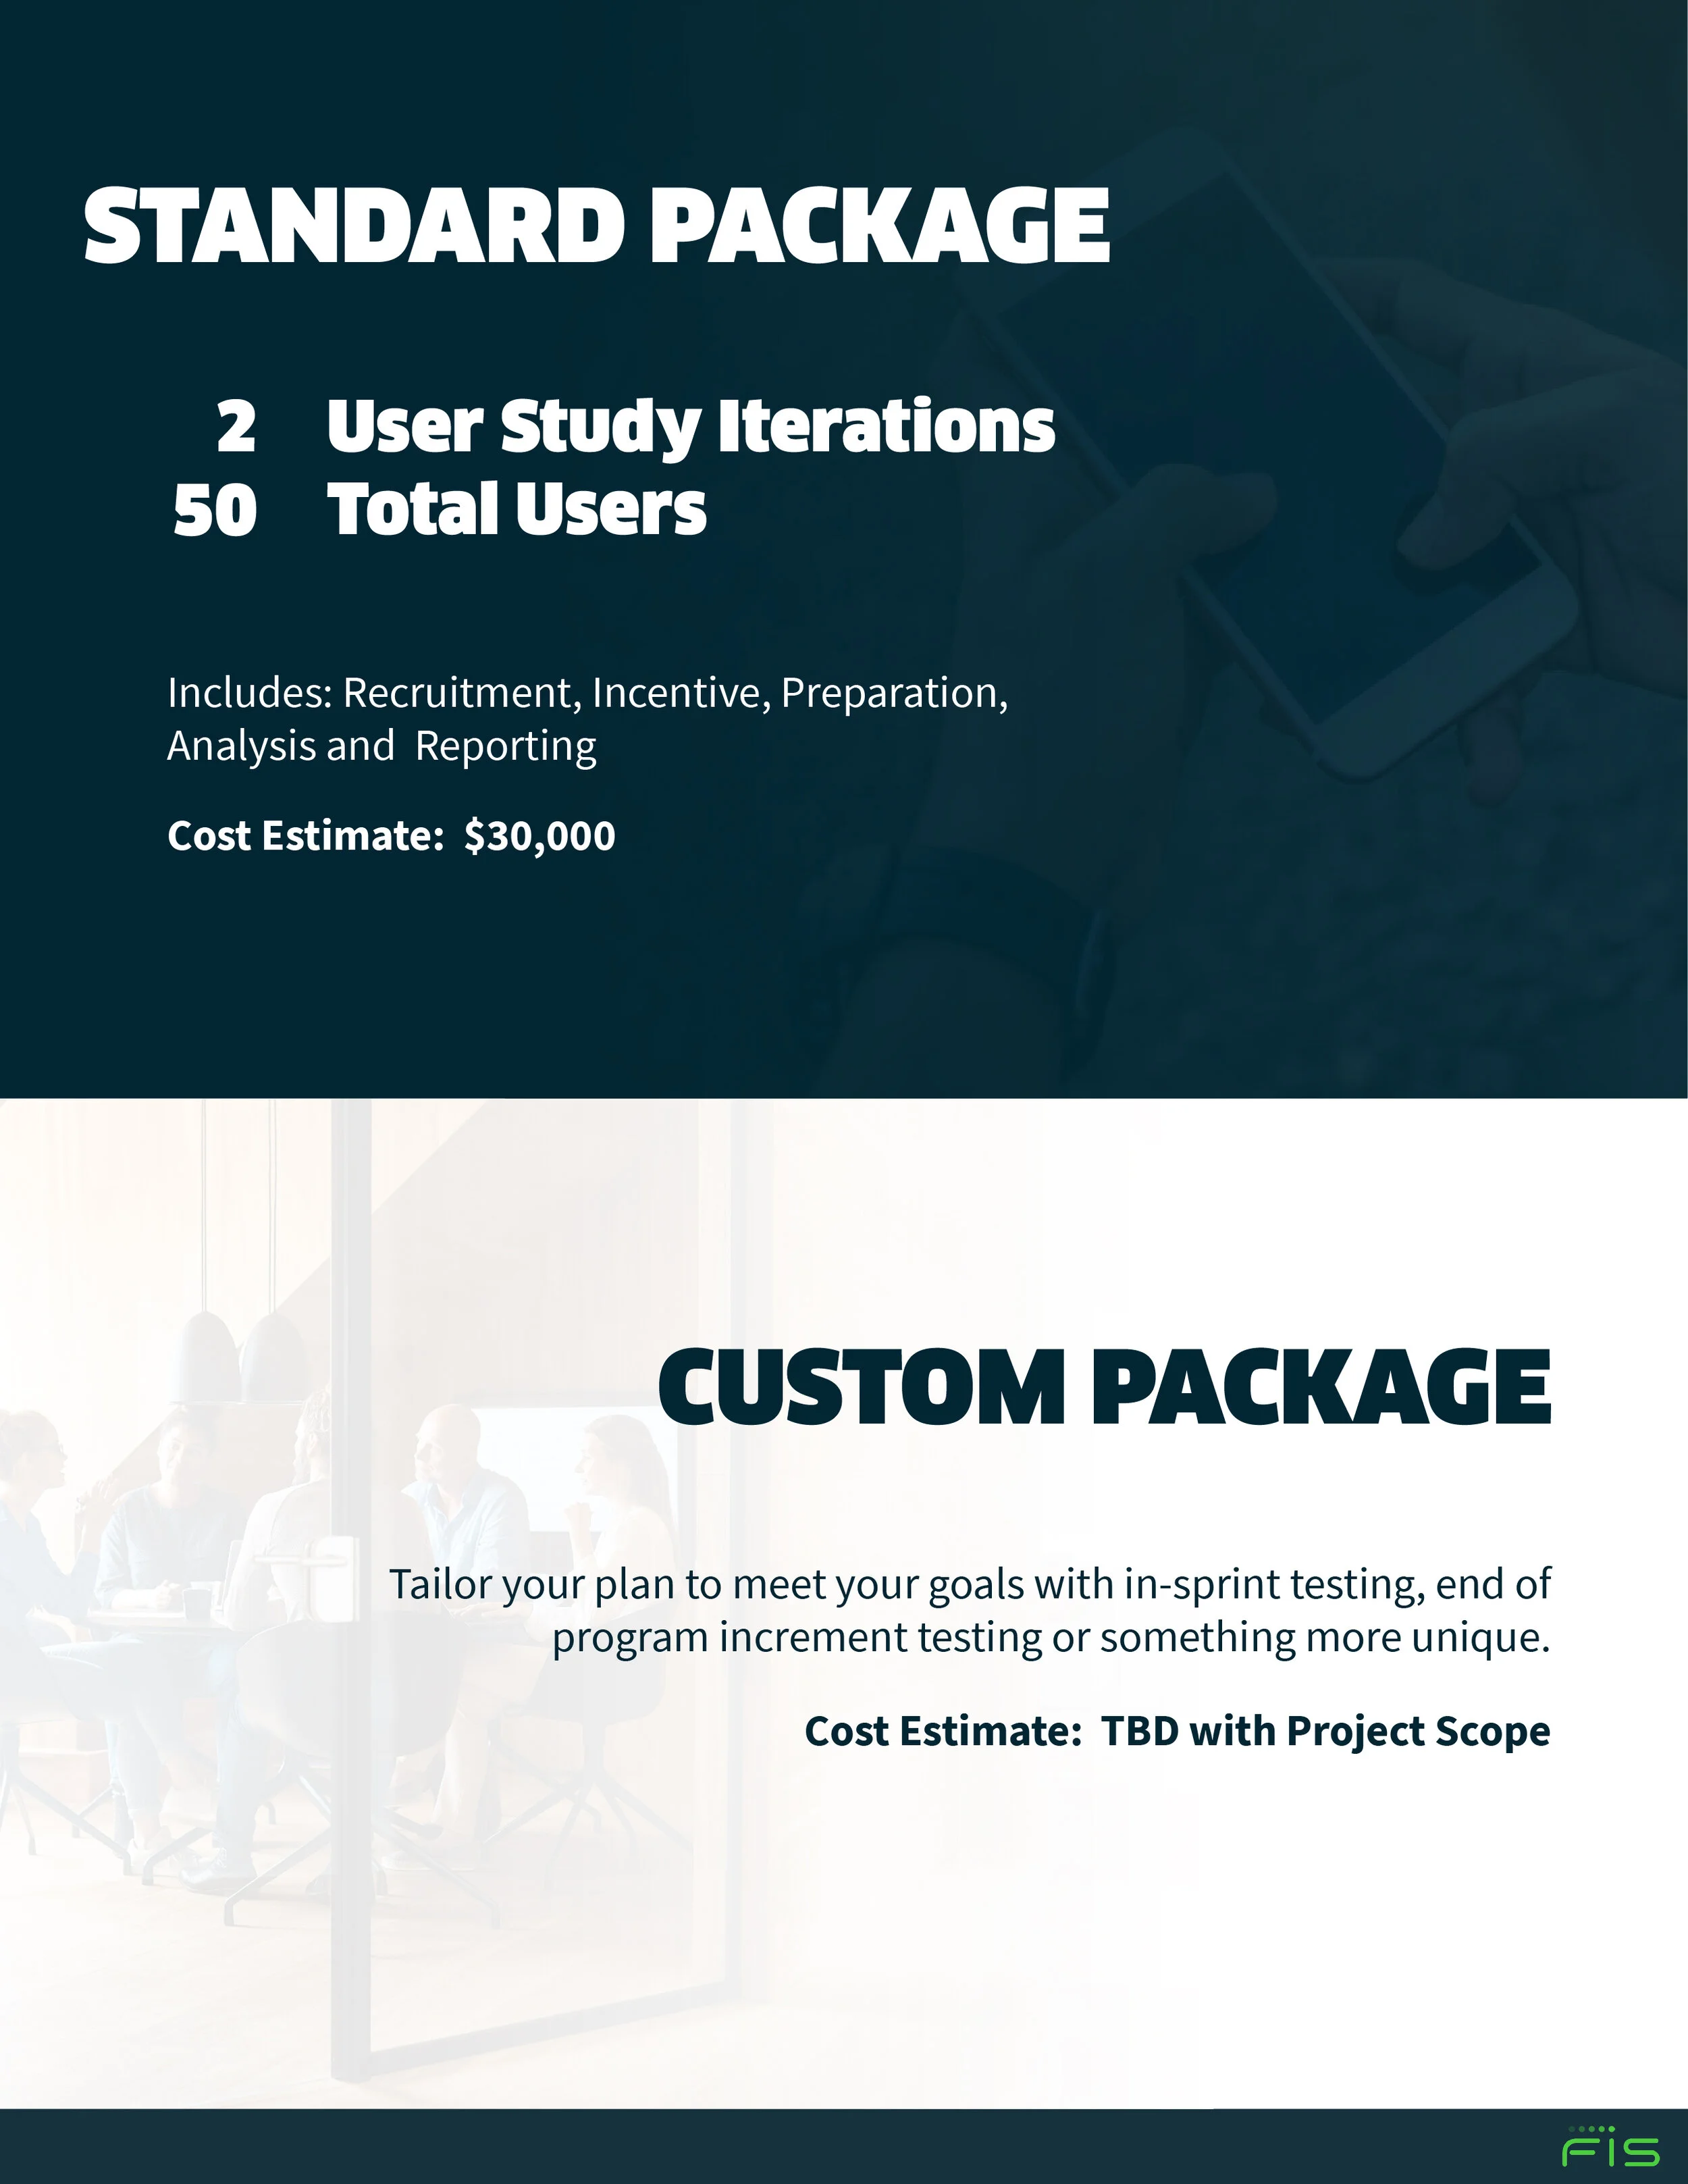
I created this sales document to explain and sell our testing process to future prospects.
Informing Future Research
Up until this point, our team had distinguished users primarily in terms of age. Generational membership (Gen Z, Millennials, etc.) was the key differentiator in understanding and evaluating microtrends in user interactions.
However, I came to realize through the surveys and testing that our users were better understood in terms of their financial goals and needs. Although goals and needs skewed with age, they were not defined by it. I categorized users into four personas and extracted the data from our studies to support them.
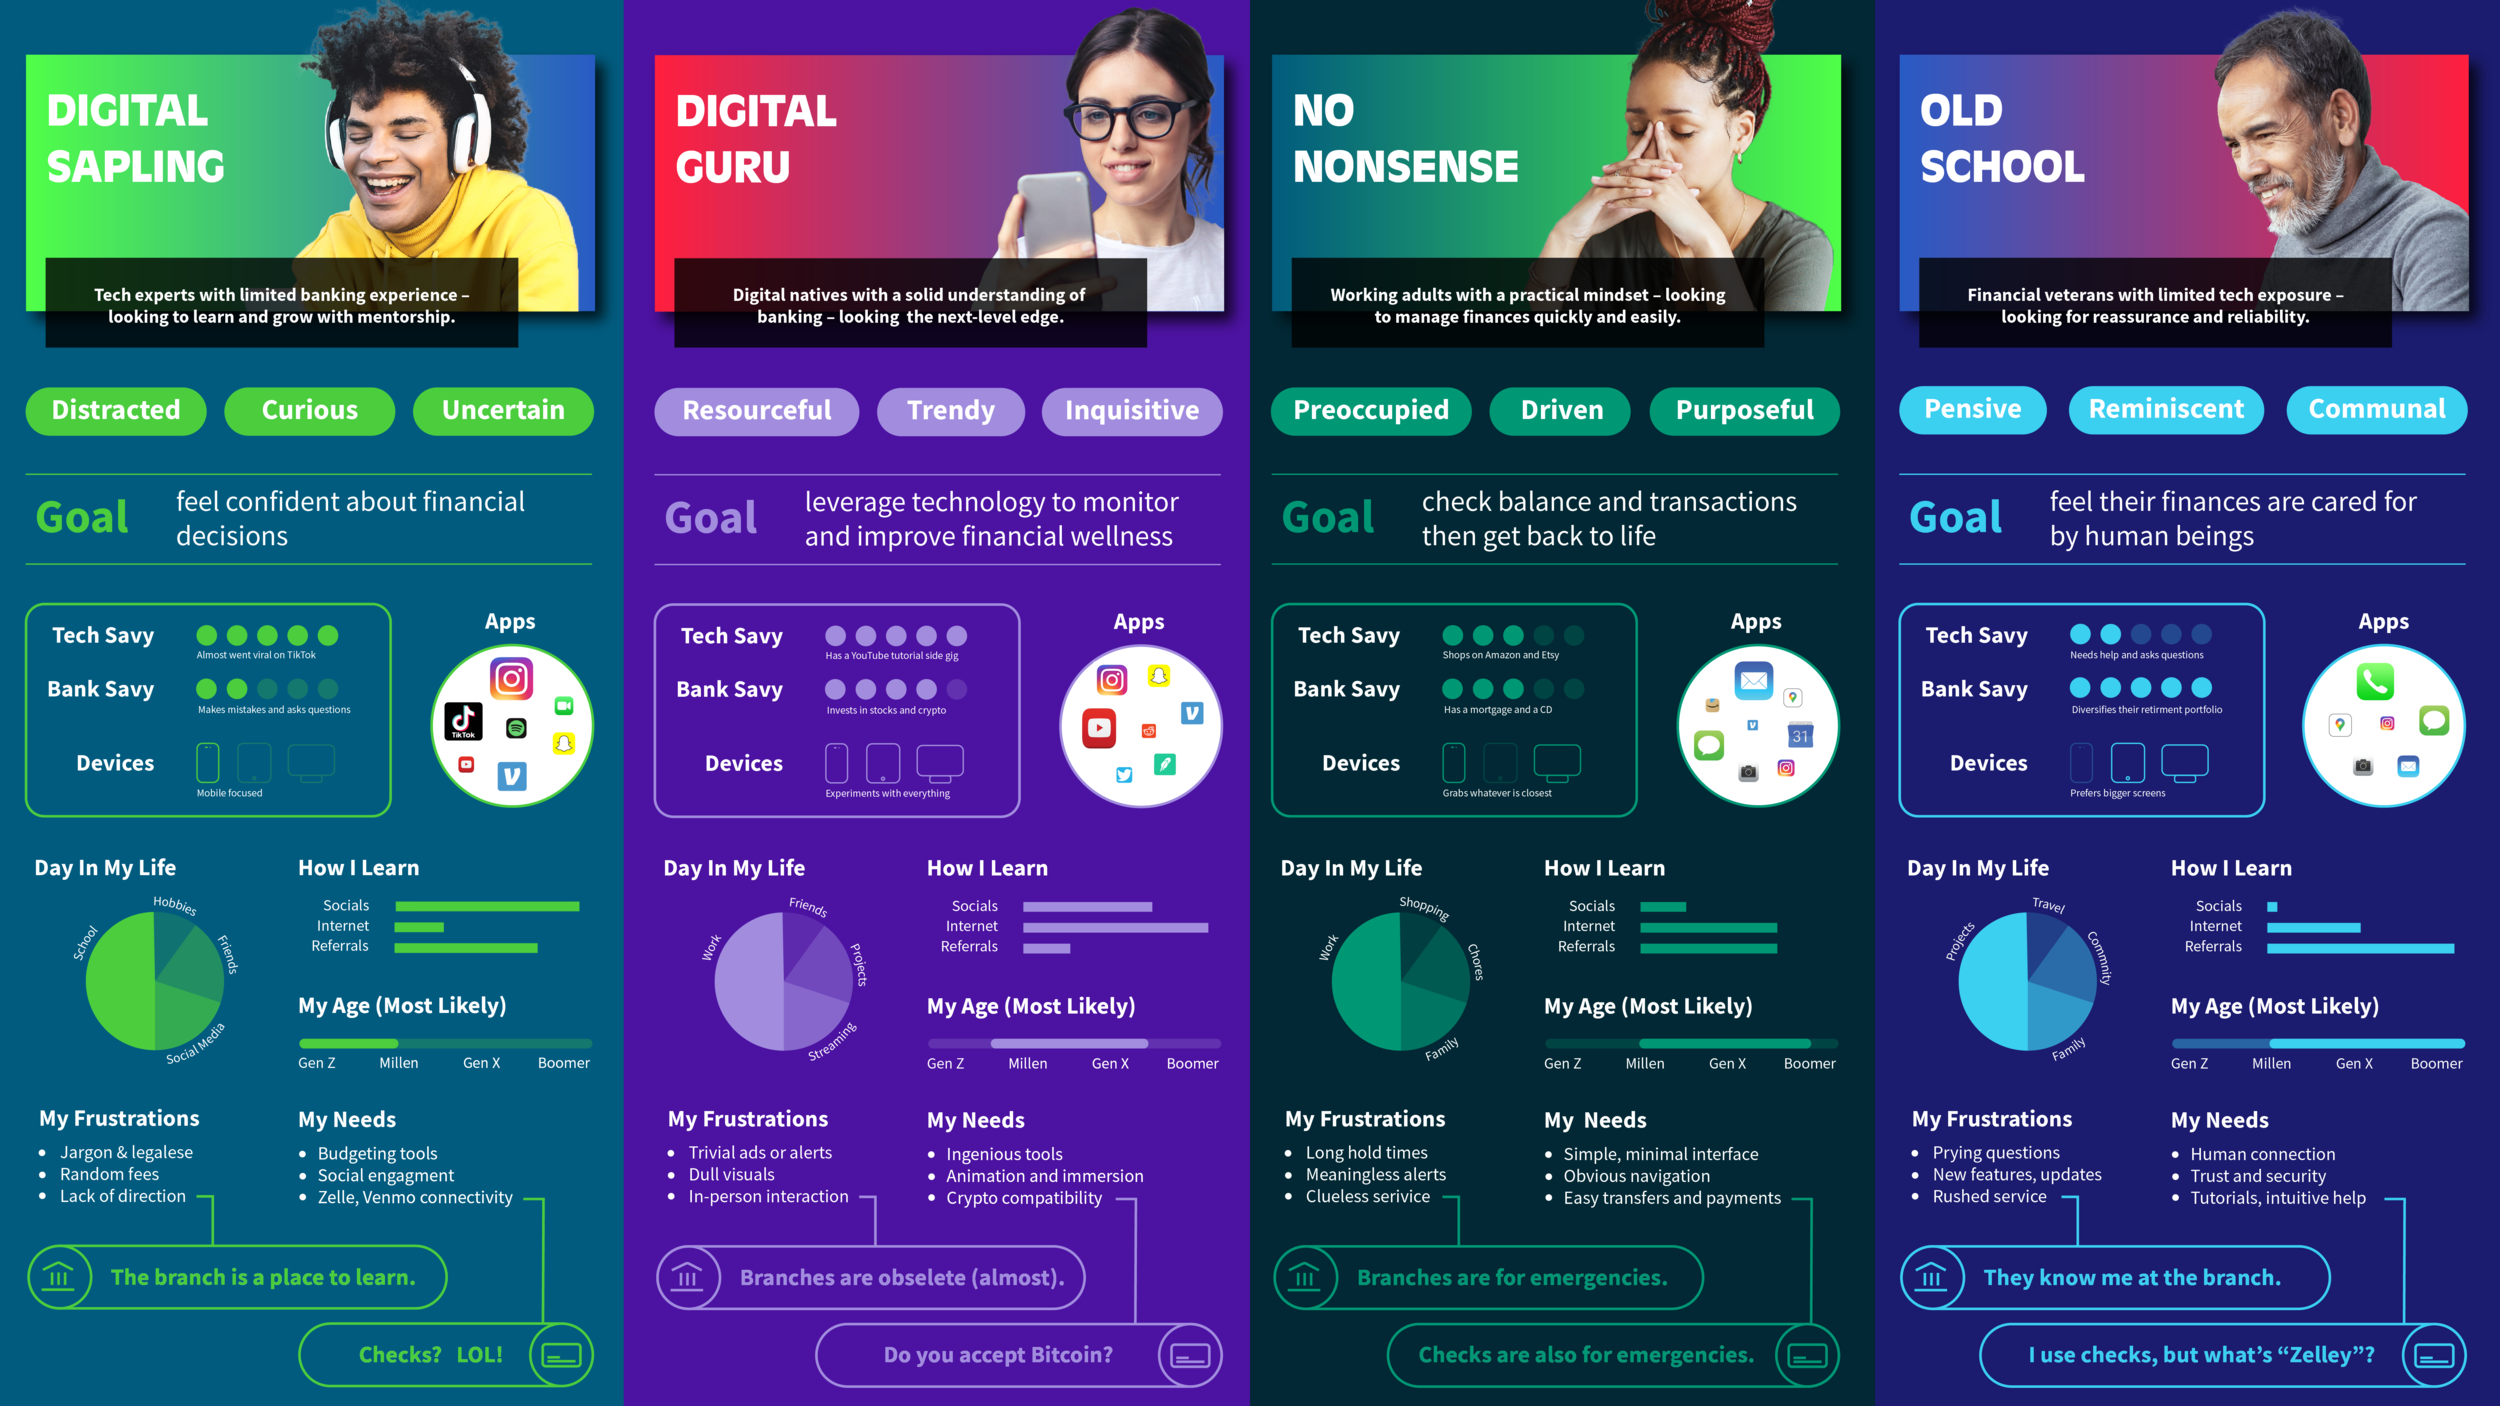
I created personas so our design team could better envision product requirements, while also showcasing user intimacy to our customers.
Lessons Learned
Iterate on strategy too: like the product, our testing strategy continues to evolve. I continue to tweak the research boards and progress reports to better showcase our findings.
Trouble-shoot in advance: guiding participants through firewalls on to a remote environment was challenging, but by revising our on-boarding documents and creating a trouble-shooting guide it became much more fluid.
Share frequently: in-sprint testing really tests a design team’s cohesion; we quickly learned that frequent sharing and daily meet-ups were a great way to keep collaboration at a high.